

HashiCorp recently proposed a new method to consume Vault secrets — the Vault Secrets Operator. By implementing a Kubernetes Operator, you can now synchronize your secrets from different Vault secrets engines like Key/Value, Database, or PKI to a Kubernetes secrets store. As a result, without any code application changes, you can now sync Vault secrets to Kubernetes Secrets.
As teams adopt the Vault Secrets Operator for Kubernetes, it becomes a critical component of their platforms and must be monitored closely. This post will walk you through how to use the Prometheus Operator and the Prometheus metrics endpoint provided in the Vault Secrets Operator. This allows users to be alerted to any potential issues with the system. You’ll also see how to integrate Prometheus output into a Grafana dashboard.
»Demo project architecture
In this walkthrough, the Vault Secrets Operator starts out deployed in a dedicated namespace called vault-secrets-operator with Helm. This is in line with our Installing the Vault Secrets Operator documentation. The Prometheus Operator will be used with kube-prometheus to simplify integration. At the end of installation, your setup should look like this:
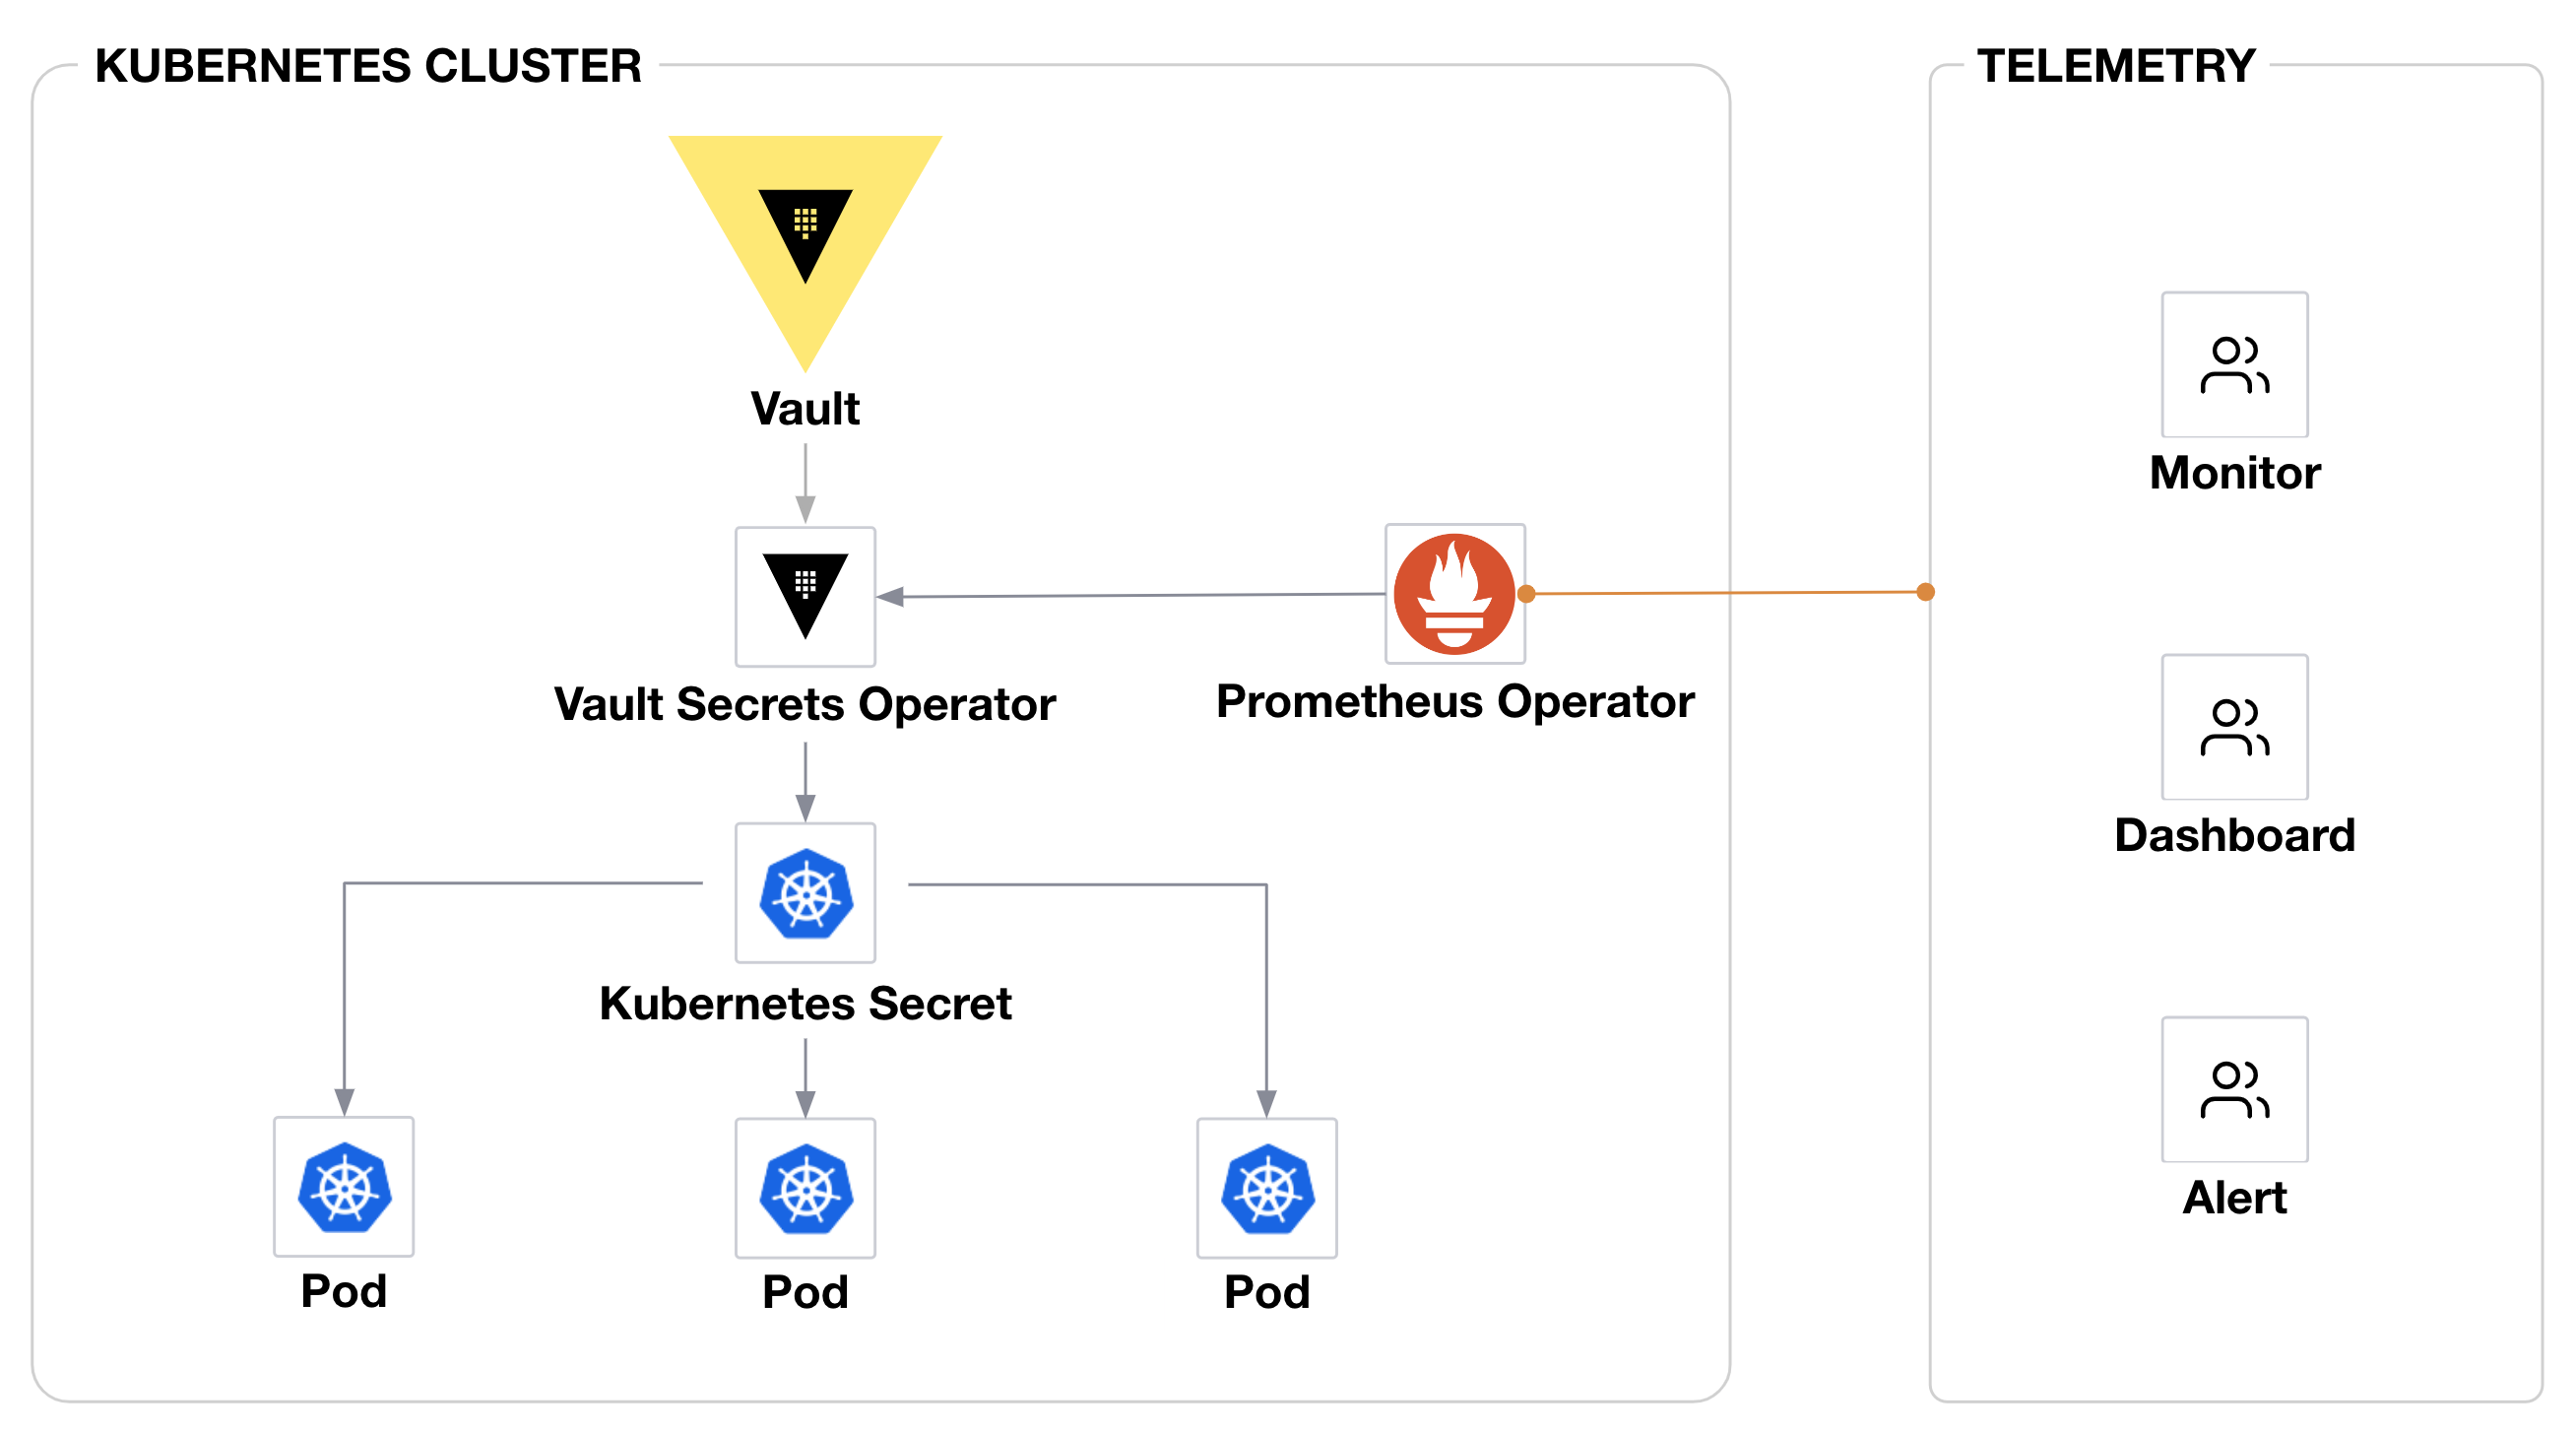
The Vault Secrets Operator is in charge of syncing secrets from HashiCorp Vault to Kubernetes Secrets and exposes metrics through the Prometheus endpoint. Those metrics are then scraped by the Prometheus Operator, which provides alerts and is used as a datasource for the Grafana dashboard.
»Deploy Prometheus Operator
The Vault Secrets Operator was built using Kubebuilder (an SDK to build Kubernetes APIs), which exposes a set of protected metrics by default. As mentioned in the Vault Secrets Operator announcement, there are a number of metrics available through an endpoint supported by Prometheus Operator.
The first step in the deployment process is to deploy kube-prometheus: a packaged method for deploying Prometheus and monitoring-related solutions like alertmanager for alerting and Grafana for dashboards.
Install kube-prometheus using Helm:
# Add helm repository
helm repo add prometheus-community https://prometheus-community.github.io/helm-charts
helm repo update

# deploy from helm repository
helm install kube-prometheus prometheus-community/kube-prometheus-stack -n observability --create-namespace
The code above deploys your Prometheus server with alertmanager and Grafana.
Next, forward port 9090 for a Prometheus service:
kubectl port-forward svc/kube-prometheus-kube-prome-prometheus 9090:9090 -n observability &
You should get access to the Prometheus UI, but note that the Vault Secrets Operator does not yet appear as a target for Prometheus scraping.
»Create the ServiceMonitor
Without kube-prometheus, you would need to grant permissions to your Prometheus server so it can scrape the protected metrics. That process would involve creating a ClusterRoleBinding to bind the ClusterRole to the service account that your Prometheus server uses. But because we’re using kube-prometheus, this binding is already deployed.
When deploying the kube-prometheus from the Helm chart, several custom objects are already created in the Kubernetes cluster. One of them is the prometheus object, which defines all configurations used by Prometheus (such as scraping endpoints, scraping interval, etc.). Here is the default config that gets deployed:
kubectl get prometheus -n observability

NAME           VERSION   DESIRED   READY   RECONCILED   AVAILABLE    AGE
kube-prome...  v2.42.0   1     	   1   	   True         True         18m
You can see that an object called kube-prometheus-kube-prome-prometheus was created, and it contains all the configurations.
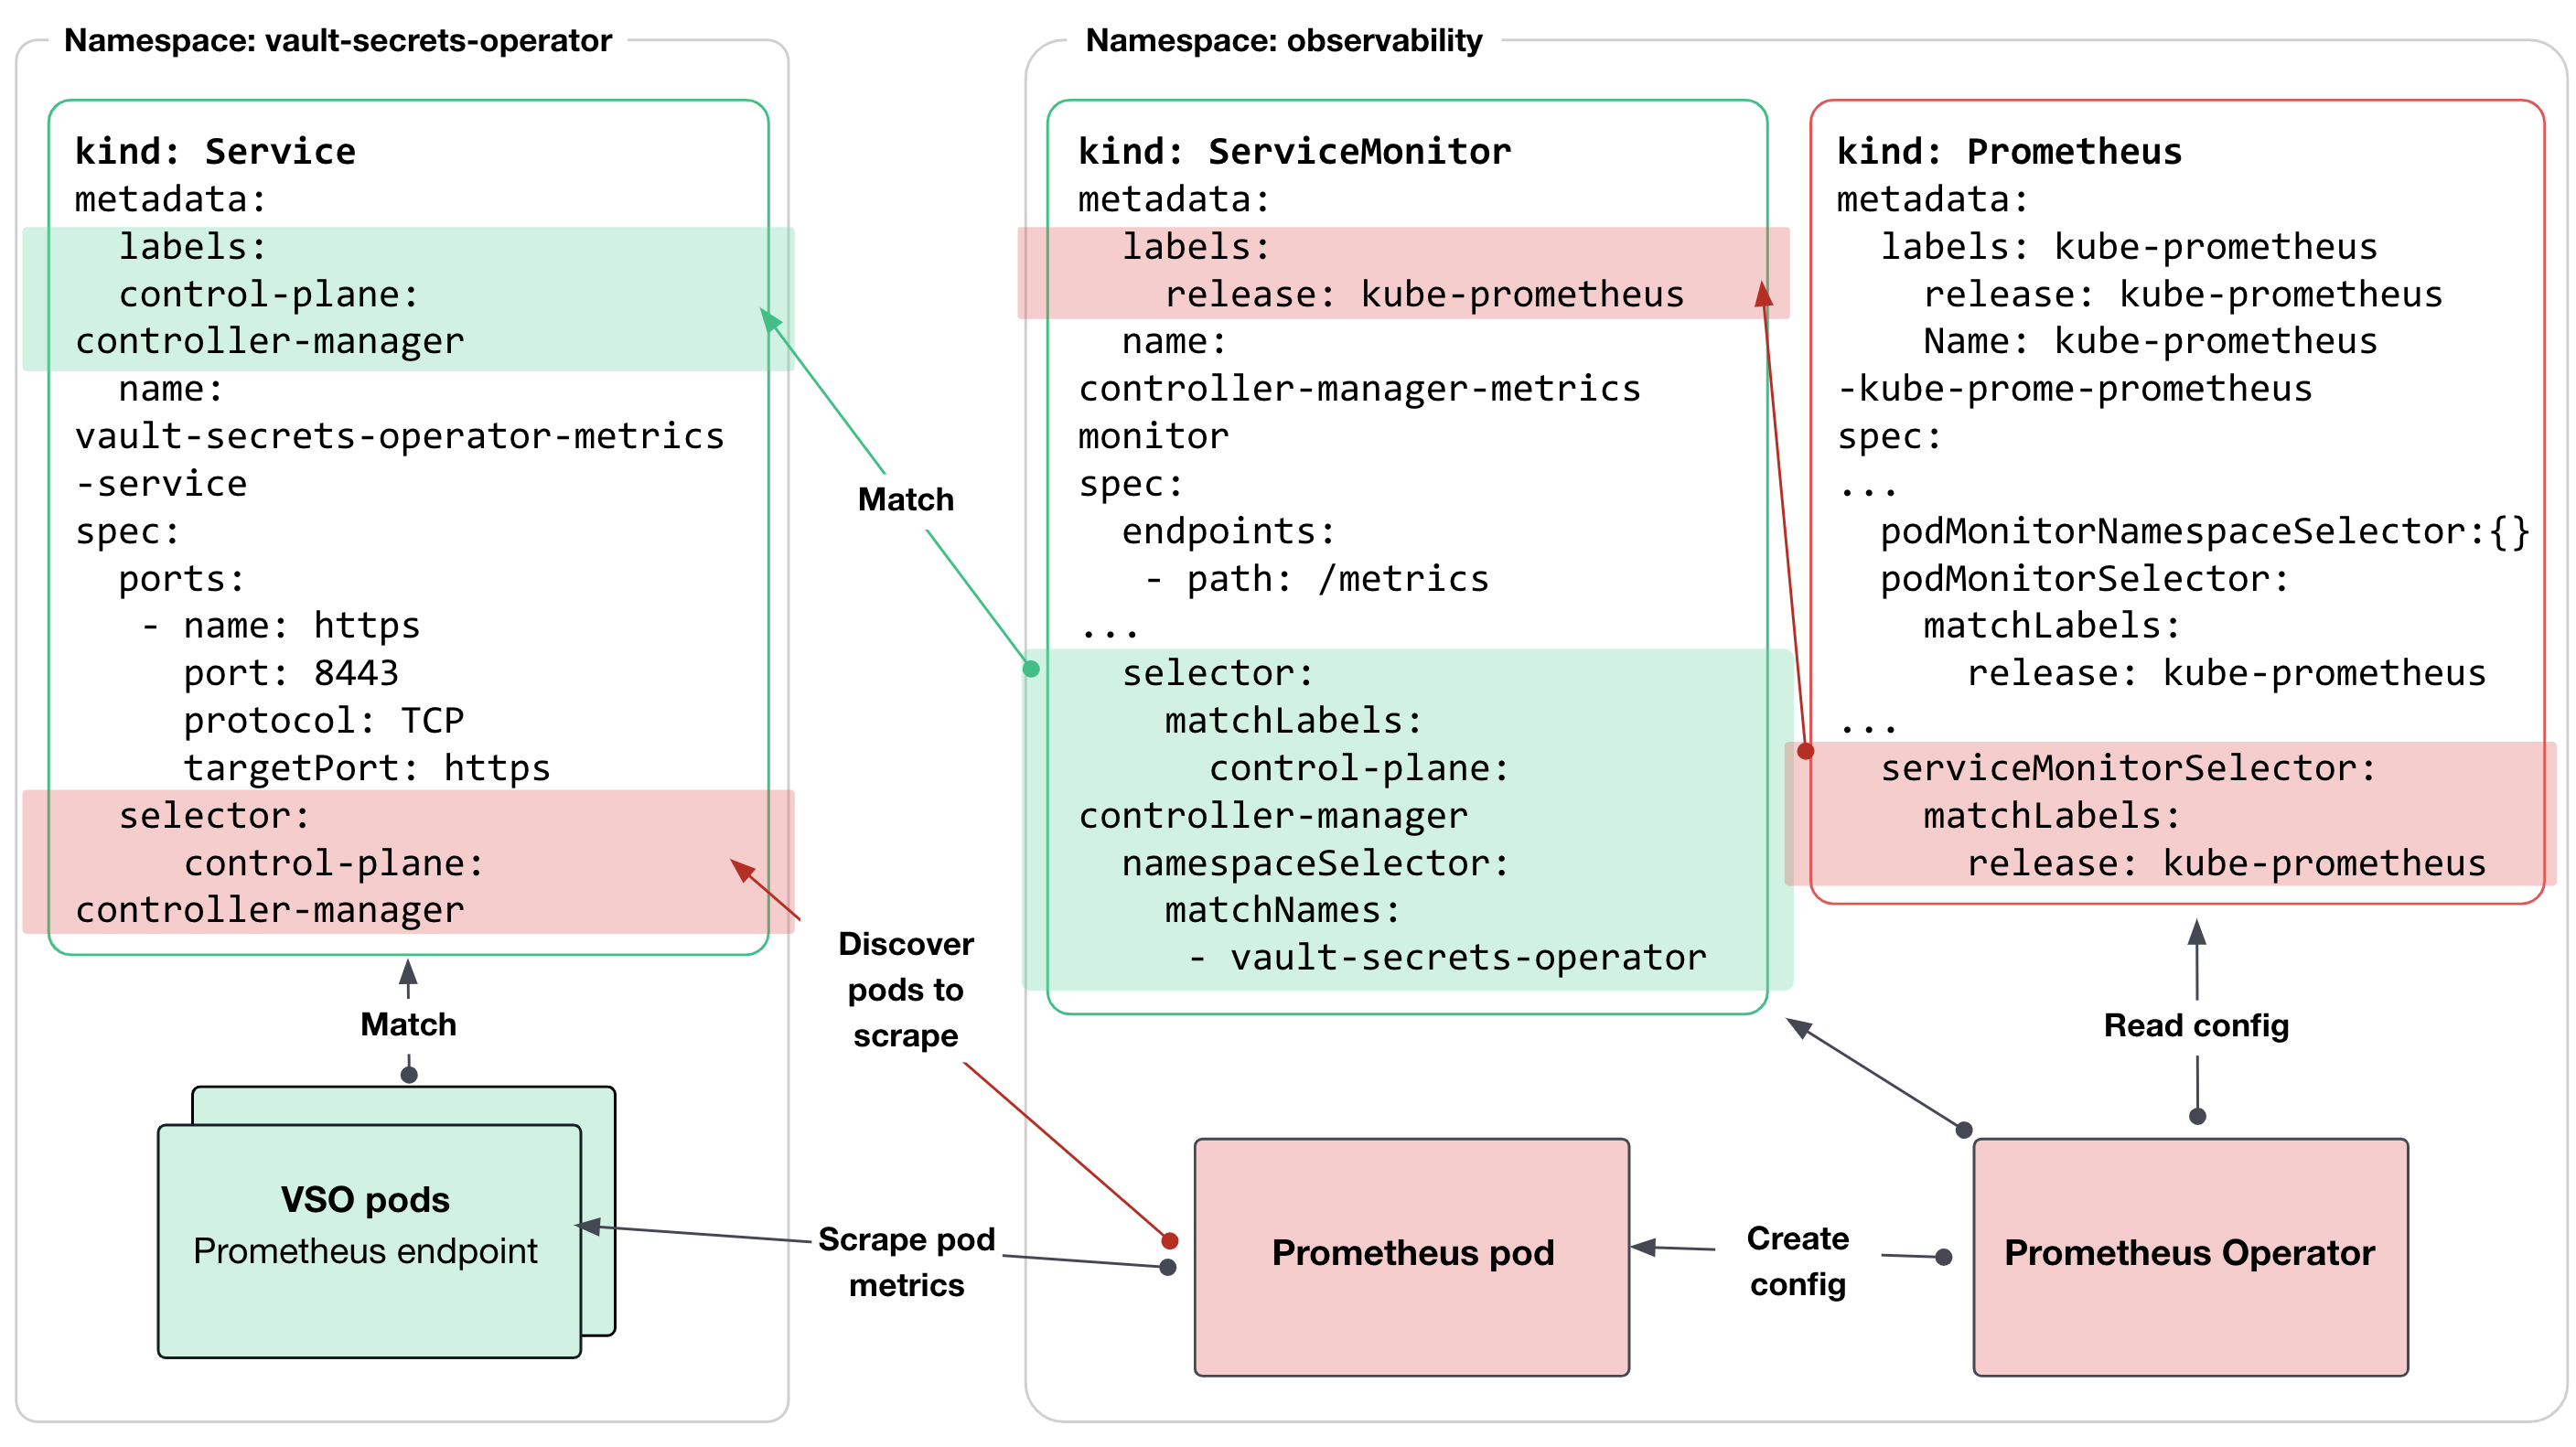
The Prometheus Operator offers multiple ways to define resources to be monitored. For the purposes of this blog post, we will use the serviceMonitorSelector:
kubectl get prometheus -n observability kube-prometheus-kube-prome-prometheus  -o=jsonpath='{.spec.serviceMonitorSelector}'

{"matchLabels":{"release":"kube-prometheus"}}
Looking deeper, you can see that Prometheus is considering all ServiceMonitor instances with the label: release:kube-prometheus (by using the serviceMonitorSelector).
So, you will next create a ServiceMonitor object for the Vault Secrets Operator. HashiCorp has a sample ServiceMonitor that you can use to start building your configuration, adding the label name: controller-manager-metrics-monitor:
cat <> servicemonitor.yaml
# Prometheus Monitor Service (Metrics)
apiVersion: monitoring.coreos.com/v1
kind: ServiceMonitor
metadata:
  labels:
    release: kube-prometheus
  name: controller-manager-metrics-monitor
spec:
  endpoints:
    - path: /metrics
      port: https
      scheme: https
      bearerTokenFile: /var/run/secrets/kubernetes.io/serviceaccount/token
      tlsConfig:
        insecureSkipVerify: true
  selector:
    matchLabels:
      control-plane: controller-manager
  namespaceSelector:
    matchNames:
      - vault-secrets-operator
EOF
In the configuration file, you will also see that the metric endpoint is protected by a token (bearerTokenFile). This is because Kubebuilder embeds configurations that enforce authentication and authorization as a default value through an auth proxy deployed as a sidecar container in the manager pod.
Apply the following configuration:
kubectl apply -f servicemonitor.yaml -n observability
The chart below summarizes the interaction between the Prometheus Operator and the Vault Secrets Operator:
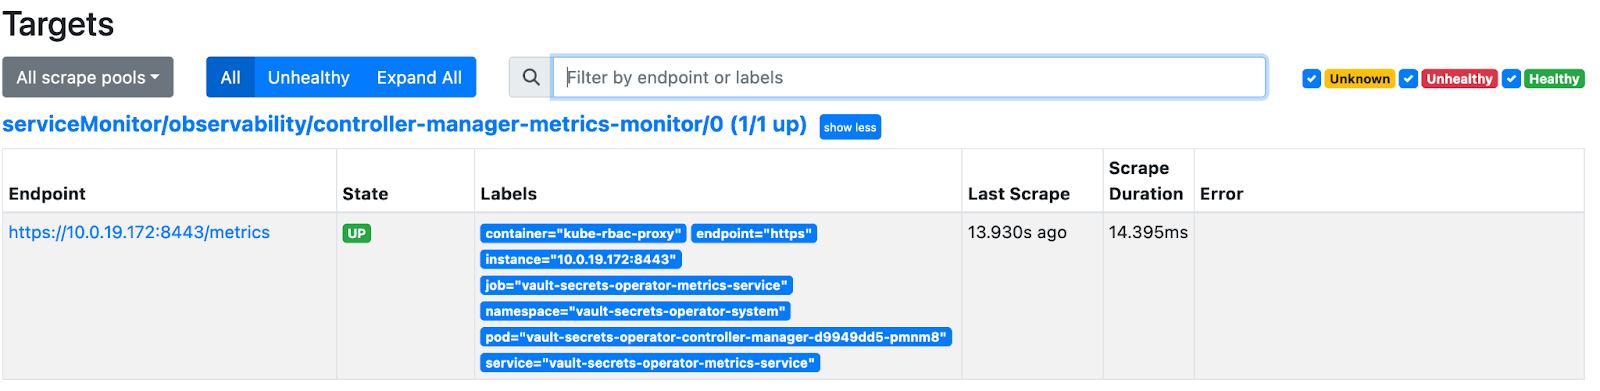
You’re now finished with the Prometheus Operator configuration. Go back to the Prometheus UI, where “controller-manager” should be coming up as a target in the Targets section:
»Grafana dashboard sample
Next, create a Grafana dashboard to visualize the data coming out of the Vault Secrets Operator. To integrate it into your stack, you may want to expose the Grafana port using an ingress controller in production, but for the purposes of this blog post, you can forward the port using this command:
kubectl port-forward svc/kube-prometheus-grafana -n observability 8091:80
You should now have access to the Grafana interface by typing http://localhost:9091 into your browser. Log in with admin as username and get the password from the Kubernetes secret store:
Username: admin
Password: kubectl get secret --namespace observability kube-prometheus-grafana -o jsonpath="{.data.admin-password}" | base64 --decode ; echo
Once you’re logged in, you can import the dashboard by going into Dashboards / import section and using dashboard ID 18656.
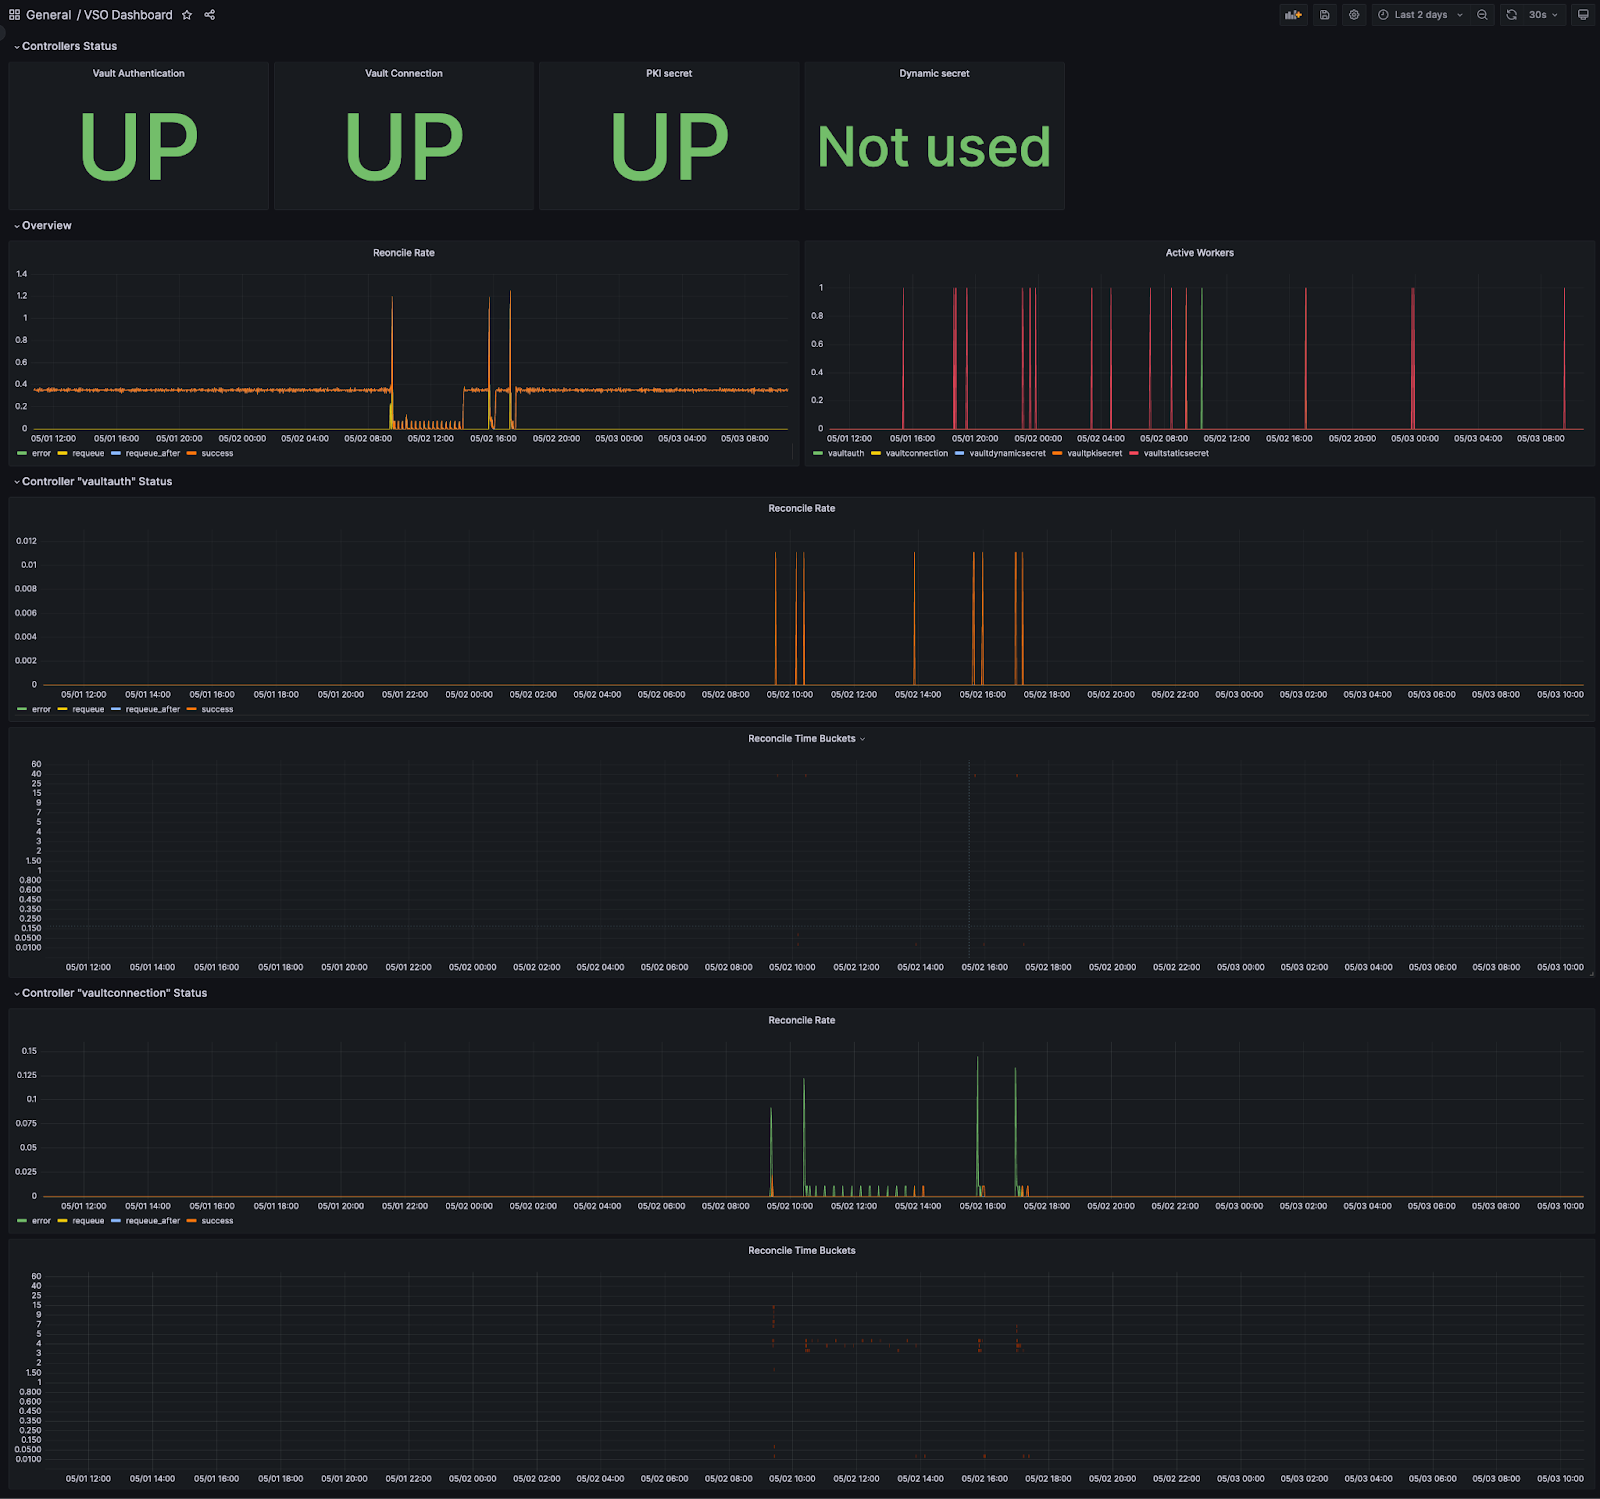
The dashboard should look like this:
It’s important to know that the Vault Secrets Operator is exposing all the reference metrics from Kubebuilder SDK, and the documentation needed to get a better understanding of those metrics can be found in this list of Default Exported Metrics References.
This dashboard is split into three parts:
Controllers Status provides a quick view of the controllers’ states.
Overview shows all controller activities
The other sections show more detailed information for each controller selected in the Grafana variables, such as the total number of reconciliations per controller and the length of time per reconciliation per controller.
This dashboard is a sample. We encourage you to customize it with critical data more closely related to your business.
»Important metrics to monitor
Kube-prometheus contains several examples of cluster alerting rules. You can find those rules in the UI using the /rules endpoint or through the command line with this command:
kubectl get PrometheusRule -n observability
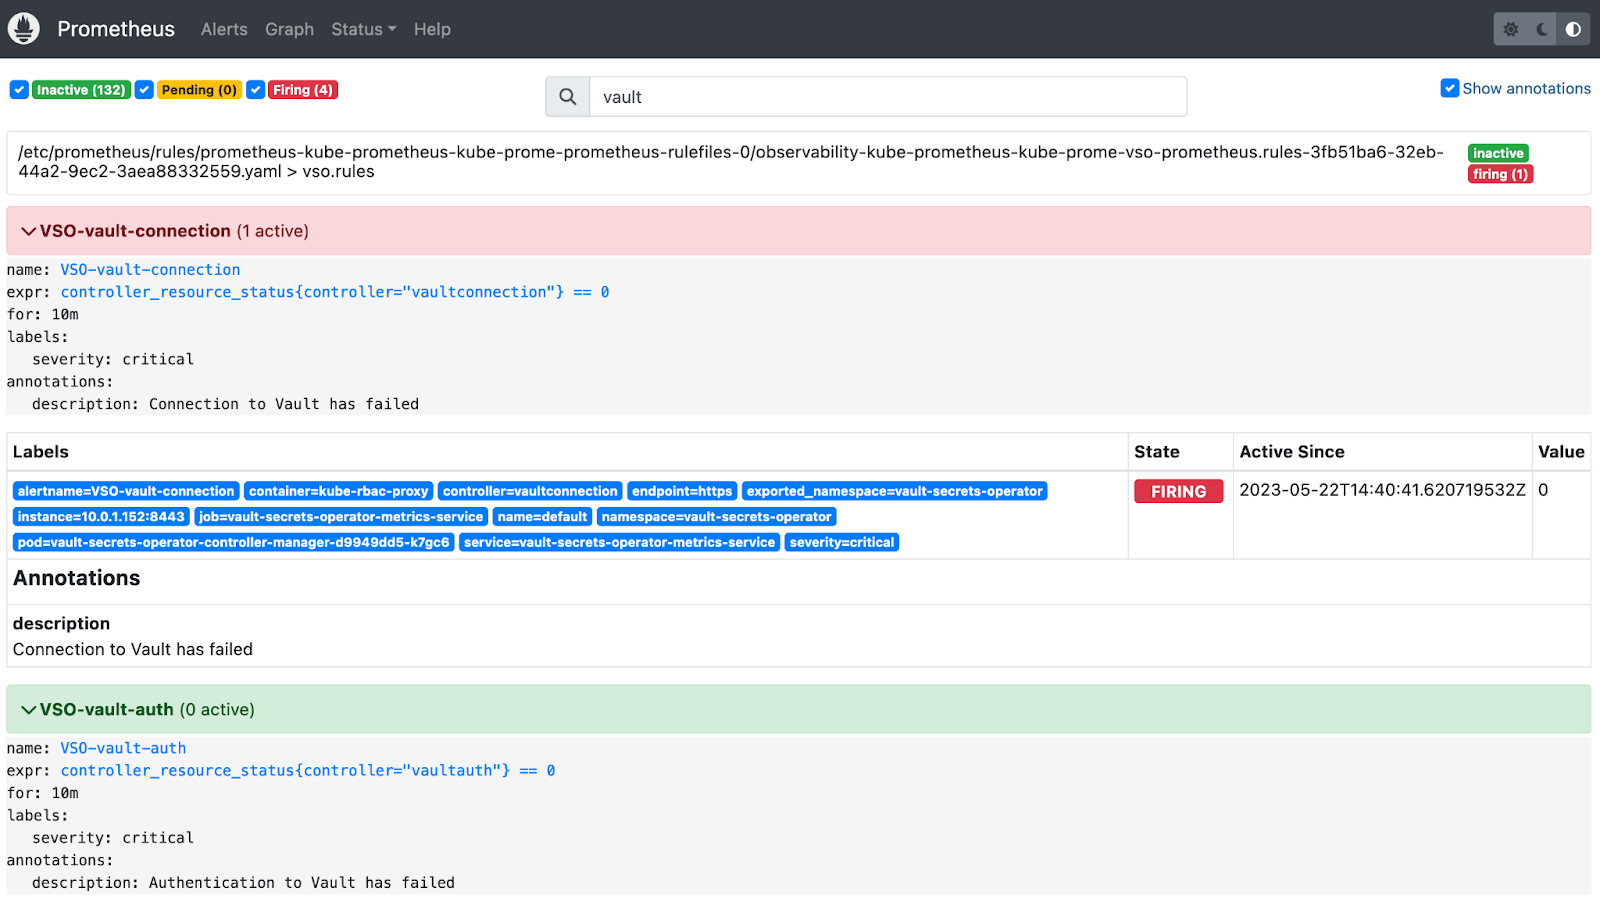
No rules are created initially to monitor your Vault secrets system.
For this demo, create this set of rules:
cat <> vso-alerts.yaml
apiVersion: monitoring.coreos.com/v1
kind: PrometheusRule
metadata:
 labels:
   release: kube-prometheus
 name: kube-prometheus-kube-prome-vso-prometheus.rules
 namespace: observability
spec:
 groups:
 - name: vso.rules
   rules:
   - alert: VSO-vault-auth
     annotations:
       description: Authentication to Vault has failed
     expr: |-
       controller_resource_status{controller="vaultauth"} == 0
     for: 10m
     labels:
       severity: critical
   - alert: VSO-vault-connection
     annotations:
       description: Connection to Vault has failed
     expr: |-
       controller_resource_status{controller="vaultconnection"} == 0
     for: 10m
     labels:
       severity: critical
EOF
kubectl apply -f vso-alerts.yaml
These rules add alerting on vaultconnection/vaultauthentication controller issues. If you are using the vaultpkisecret or vaultdynamicsecret controllers on different namespaces, you may want to make similar alerts for those as well.
»What’s next for the Vault Secrets Operator
As more users begin to adopt the Vault Secrets Operator, it will become a critical part of the production stack in charge of syncing secrets between a centralized HashiCorp Vault and Kubernetes secret store. This means that teams will need to closely monitor this operator.
The example workflow in this blog post is intended to help you get started building an observability solution for the Vault Secrets Operator based on the Prometheus Operator with Grafana for dashboarding and Alertmanager for alerting.


