Splunk app for monitoring HashiCorp Vault
We are pleased to announce the launch of our Splunk app to help you with the out-of-the-box HashiCorp Vault monitoring experience. The app helps you understand how Vault is doing from an operational and security perspective in a multi-tenant environment, and comes with pre-built dashboards and reports that span various monitoring use cases. It is also accompanied by an updated Vault Monitor Telemetry and Audit Device Log Data with Splunk guide, that includes recommendations on the most important metrics to monitor, why they are important to monitor, thresholds to be watched out for, and more.
Vault Enterprise users can complete the Splunk app request form to request access to the app.
This app is a result of HashiCorp and Splunk working together to help enterprises accelerate cloud adoption and migration in a meaningful way. Splunk is used by over 90% of the Fortune 100 to investigate and analyze data across any infrastructure and brings a data-driven approach to searching, monitoring, and visualizing data in realtime. Splunk enables IT operations, security, DevOps, and analytics teams to make better, faster decisions with real-time visibility across their organization. You can read more about HashiCorp and Splunk working together over on their blog post.
»Sources of Data
The Splunk app uses data from Vault’s telemetry feed, platform data collected by the Telegraf agent, and Vault’s audit device log:
Telemetry: Vault’s telemetry contains metrics from each of Vault’s subsystems. These metrics can be streamed using the StatsD format, or gathered in from a pull endpoint by Prometheus.Prior to Vault 1.5, Vault telemetry was mainly focused on timing measurements, for example, metrics about the latency of storage accesses or metrics about the amount of time the Go runtime spends performing garbage collection. This type of information is useful for assessing the health of a cluster, but less useful for understanding how that cluster is being used by applications and users. In Vault 1.5, we have added a new set of high dimensional usage metrics to telemetry. These metrics include count metrics that measure token and entity creation, and gauge metrics about tokens, entities, and secrets. Each of the usage metrics includes one or more of the following dimensions as labels: cluster, namespace, auth_method, mount_point, creation_ttl, token type, policy, and secret_engine. To refer to a full list of all the supported Vault telemetry metrics, refer to our telemetry documentation.
Telegraf: In addition to the data Vault provides, the Splunk app also collects operational data from the platform on which Vault is running via Telegraf, a server agent. This data includes CPU usage, network and disk utilization, and other similar metrics.
Audit device logs: The Vault audit device log contains JSON-formatted versions of every request and response payload handled by Vault. It provides a detailed history of how Vault has been used. It is primarily meant as a security feature, but can be used for monitoring as well. In Vault 1.5, we added a new field to each response entry indicating the mount type which processed the request. This additional context aids in building queries about a particular type of operation.
»Sample Use Cases and Metrics
The Splunk app helps with different Vault monitoring use cases. From the operational health standpoint, it provides you with information on whether Vault and its storage backend are running as expected. For example:
- When using Vault, encryption can place a significant demand on the CPU. If the CPU is too busy, Vault may have difficulty keeping up with the incoming request load. Keeping track of the percentage of CPU being used by user processes (such as Vault or HashiCorp Consul) and the percentage of CPU time spent waiting for I/O tasks to complete can help keep a tab on Vault’s CPU usage.
- In Vault, all runtime threads are blocked until garbage collection completes. Normally these pauses last only a few nanoseconds, but, if memory usage is high, the Go runtime may perform garbage collection so often that Vault slows down as a result. For this reason, you may monitor the number of nanoseconds consumed by garbage collection pauses (since Vault started) to help understand if this is being performed as expected.
From the security monitoring standpoint, the Splunk app provides information on how users and applications are consuming Vault from both the telemetry usage metrics and audit log data. This data can be used to interpret if Vault is being misused (and thereby security compromised). For example:
- In Vault, a token is used to control access. Measuring the creation of tokens is a key usage metric, as is understanding the security exposure of those created tokens. In relation to this, using the Splunk app, you can measure how many “root” tokens currently exist, whether the existing tokens have short lifespans (which is generally a best practice) or long lifespans, and understand which authorization methods are being used to log in to Vault.
- Once you know that there are tokens with long lifetimes in Vault, you can drill deeper with Splunk queries to find where those tokens are originating. From Vault telemetry, you can easily query how many tokens are being created in a given interval, filtered by the token time-to-live. This data can be grouped by namespace or by authentication method to identify a particular user that might need advice on best practices, or a login method that is configured with a long default time-to-live. This information can then be taken to the audit log to identify individual users or IP addresses, if desired.
- In Vault, an entity uniquely identifies a user (either a human or a server account) across the different login methods that they might use. These identities are automatically created in some cases, so you may be interested in understanding the size of your user base, and which methods are driving their usage. The Splunk app provides information on identity entity creations, counts, and alias counts.
- Understanding how many secrets are being stored within Vault will help you judge usage by your internal teams and to understand your security footprint. From the Splunk app, you can leverage gauges that count the number of secrets stored in key-value secret engines so that your team can understand top contributors and rates of growth. Also, using audit log interpretation data, you can learn how your KV secrets engine operations (read, list, etc.) are distributed by path per namespace.
The Vault Monitor Telemetry and Audit Device Log Data with Splunk guide contains a list of all the metrics we recommend you monitor, many of which are also pre-built into the Splunk app dashboards.
»User Experience
The Splunk app consists of seven pre-built dashboards and four reports. The entry point is a summary view of key metrics such as host health and top-level indicators of usage. You can then dive deeper into operational health metrics from telemetry, usage metrics from telemetry, audit log data, backend storage performance metrics (which is key to a healthy Vault cluster), resource quota metrics, and a special use case page that provides information on where the ‘high TTL tokens’ within Vault are created. If you lack some of the metrics either because they’re running an old version of Vault or because they have audit logs disabled, those specific visualizations remain blank.
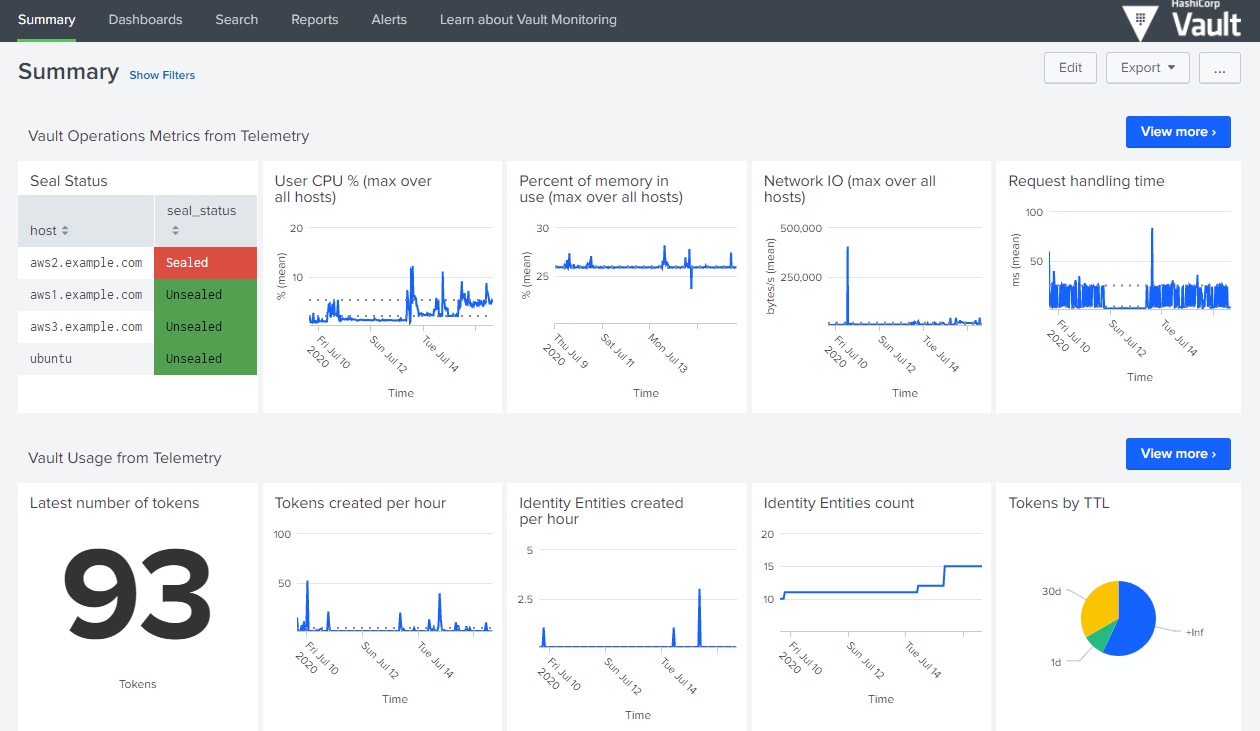
Image 1: Cluster summary dashboard
We designed the app to give context to information that is overwhelming in the raw audit log feed, or buried in Vault’s telemetry. For example, the visualization (image 2) below shows error count. This can be filtered by path or namespace or even IP address to get a more narrow view of a specific user. Other visualizations (image 3) help users identify hotspots in their usage, or unusual behavior on a certain secret path.
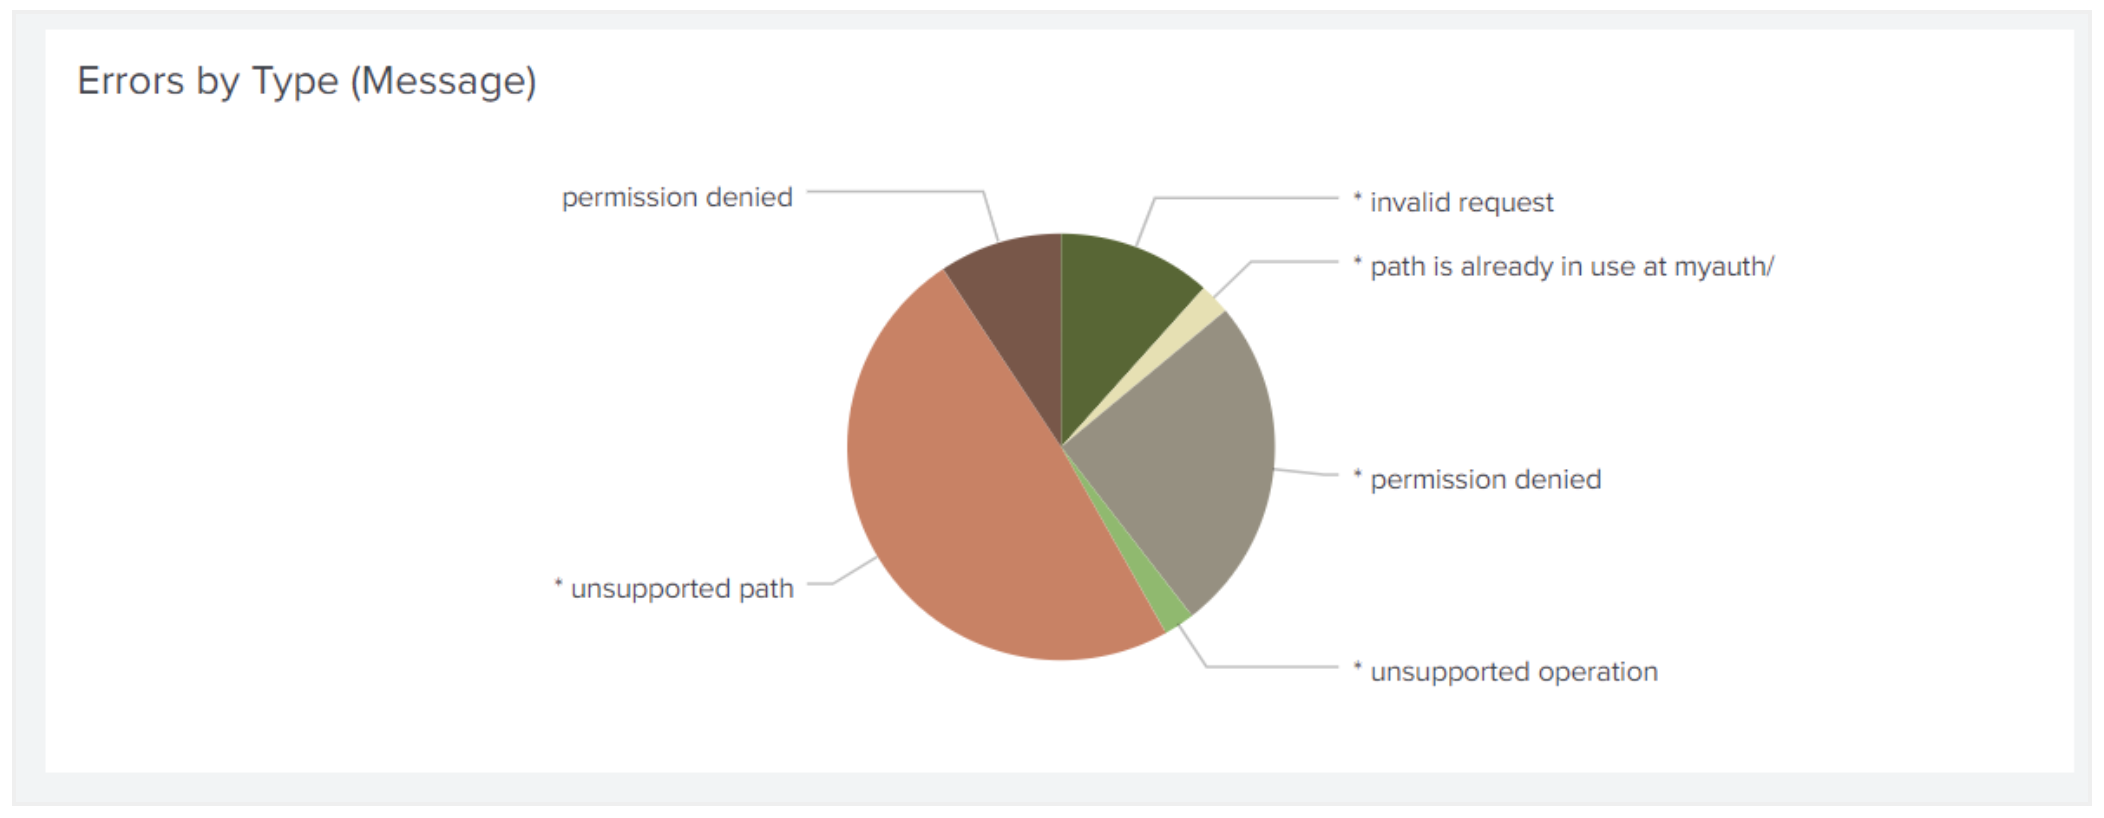
Image 2: Error counts by type
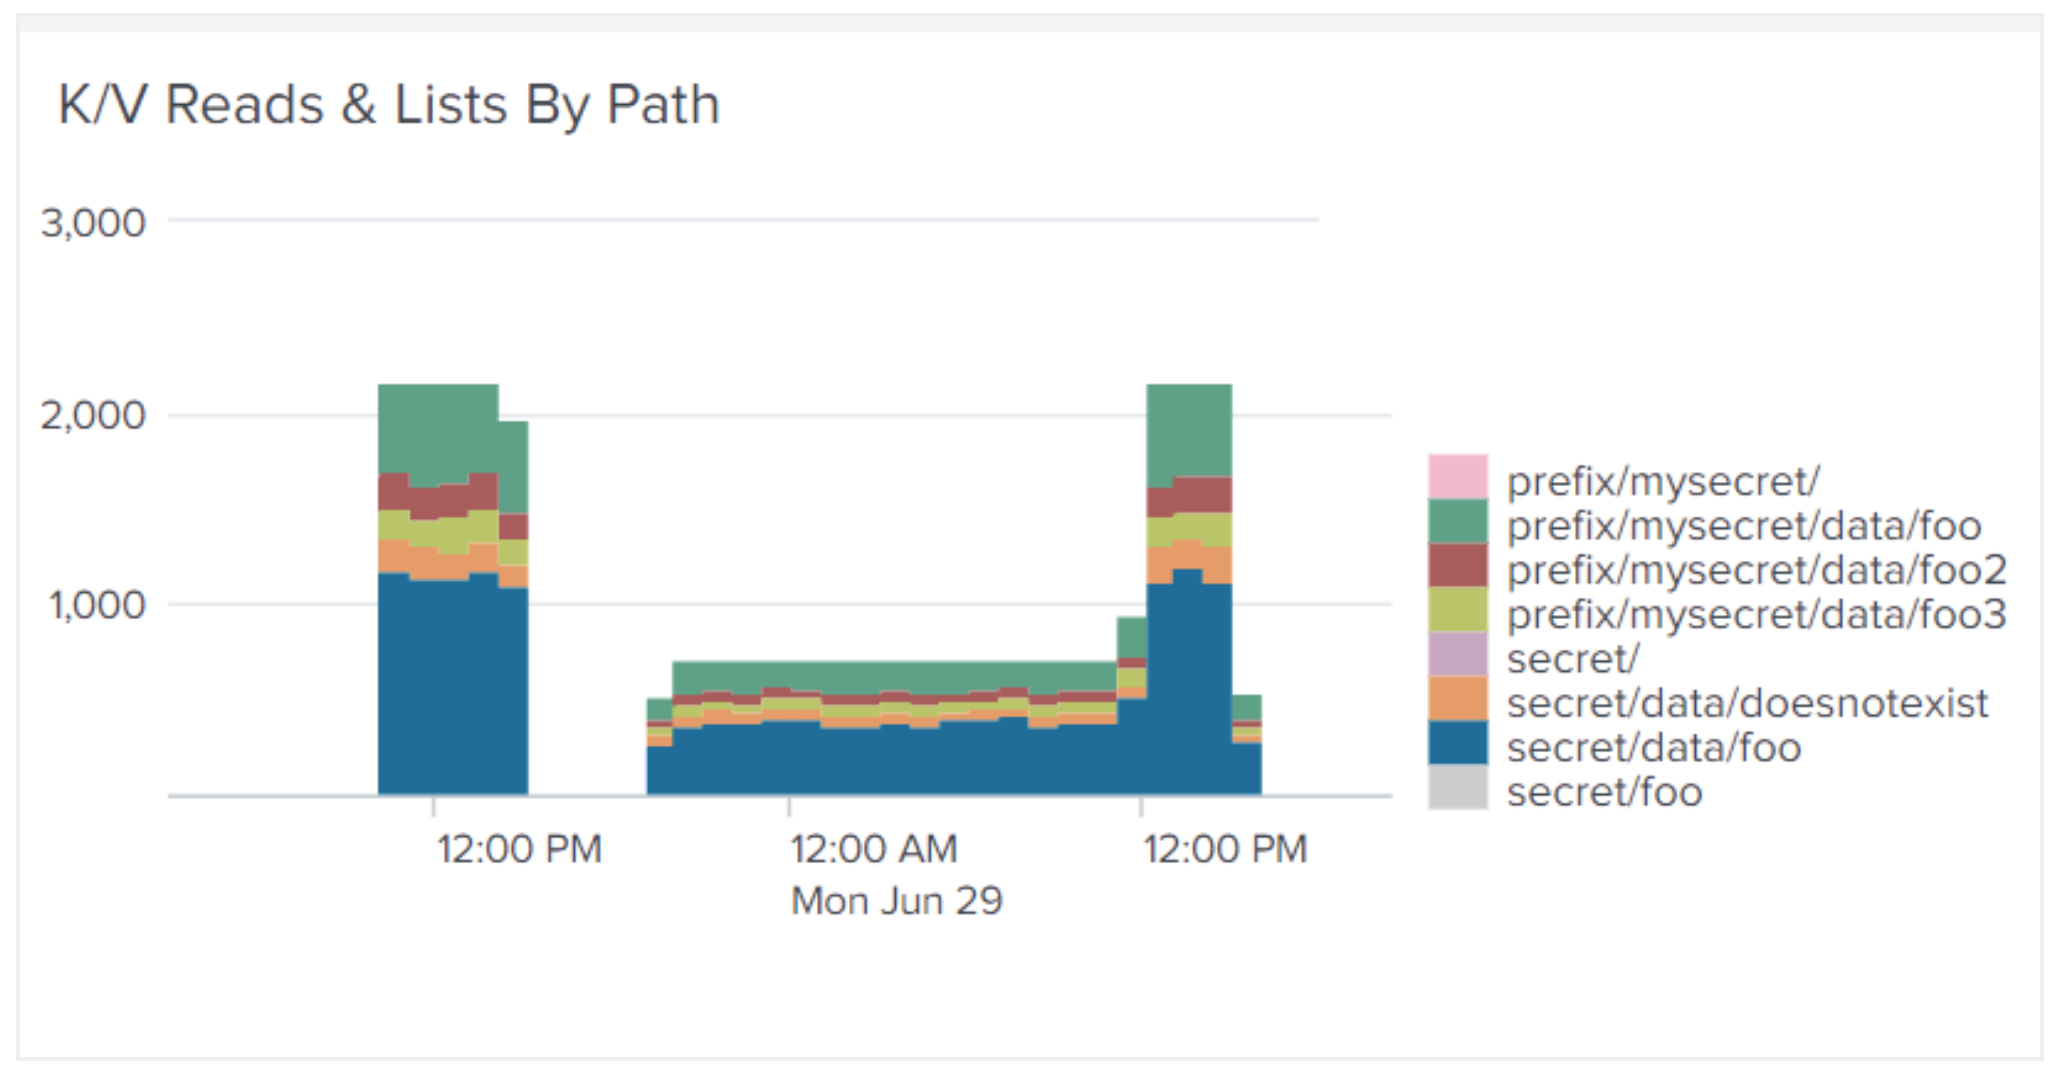
Image 3: KV reads and lists by path
Each page starts with a high-level view of the available information. Splunk’s filtering capabilities let users obtain more granular information by dropping down to particular clusters, namespaces, or hosts highlighted in that summary view, or choosing a particular time range from the accumulated history. A view that shows 20 hosts on the same timeline allows you to see outliers; you can then select a subset of hosts on that same visualization to more clearly see trends (see image 4 below).
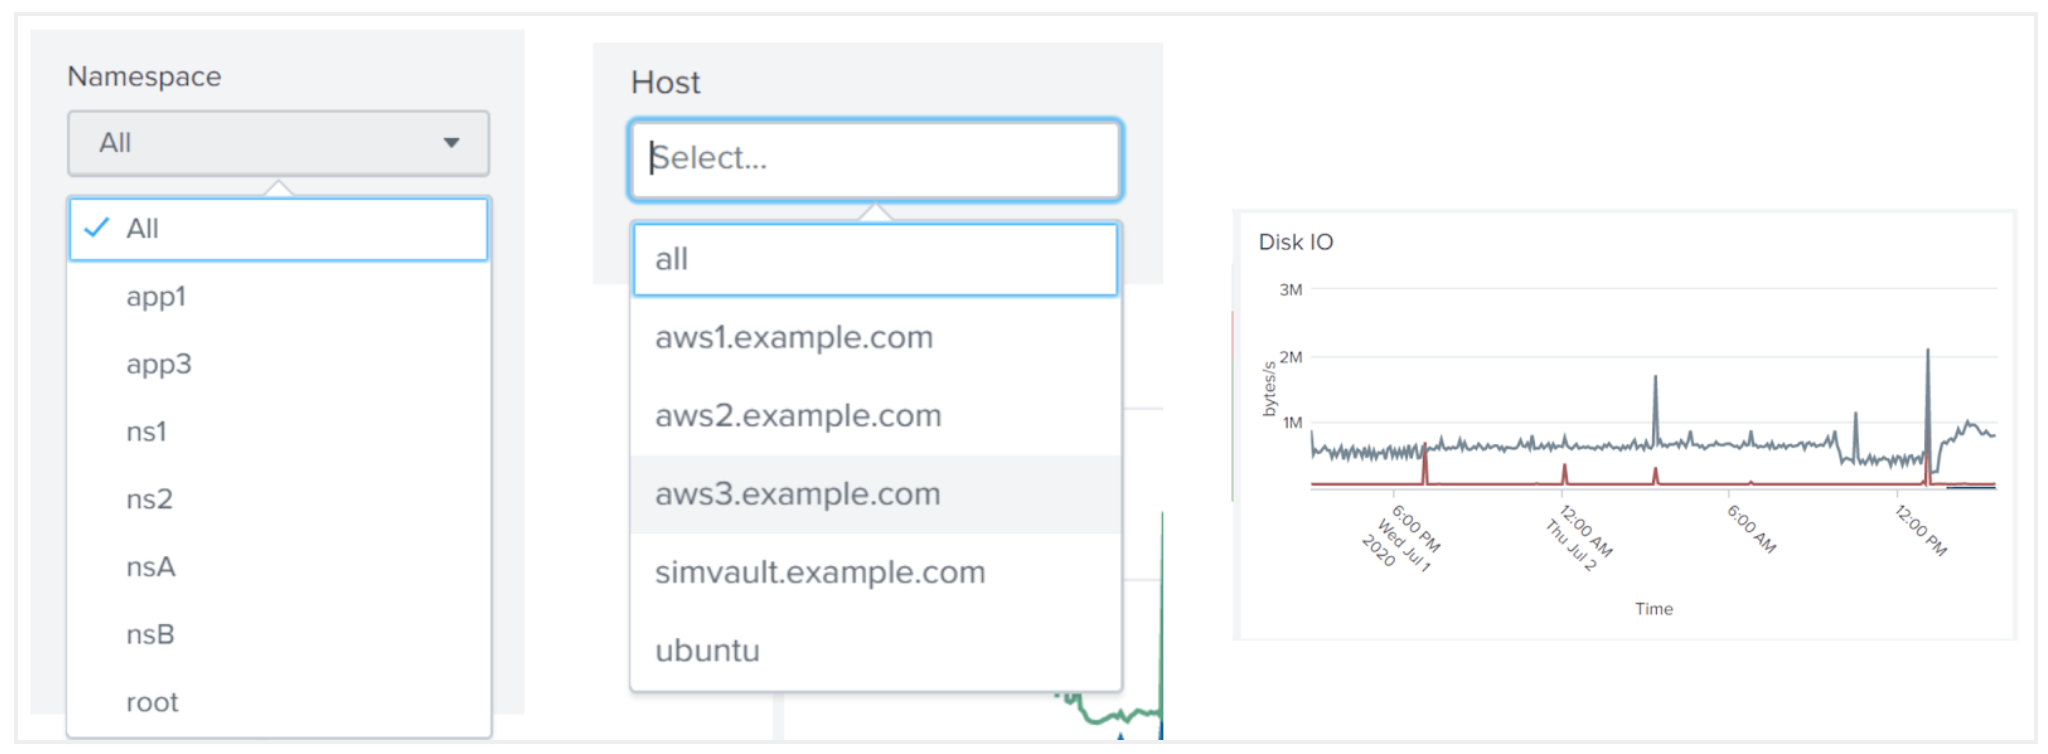
Image 4: Filtering data in Splunk
The updated learn guide provides lots of practical advice on what metrics to monitor, with recommendations about threshold values or how to estimate a normal range. In the Splunk app, those recommendations appear as a query and visualization, which can be adapted to your requirements. For example, one metric measures the amount of time that the Go runtime spends performing garbage collection, as a cumulative number of nanoseconds. Our guide notes that this needs to be converted into a rate, then compared with some recommended threshold values. The visualization below (image 5) is the “infrastructure as code” version of the text; it faithfully implements our recommendation by plotting the rate alongside the threshold values.
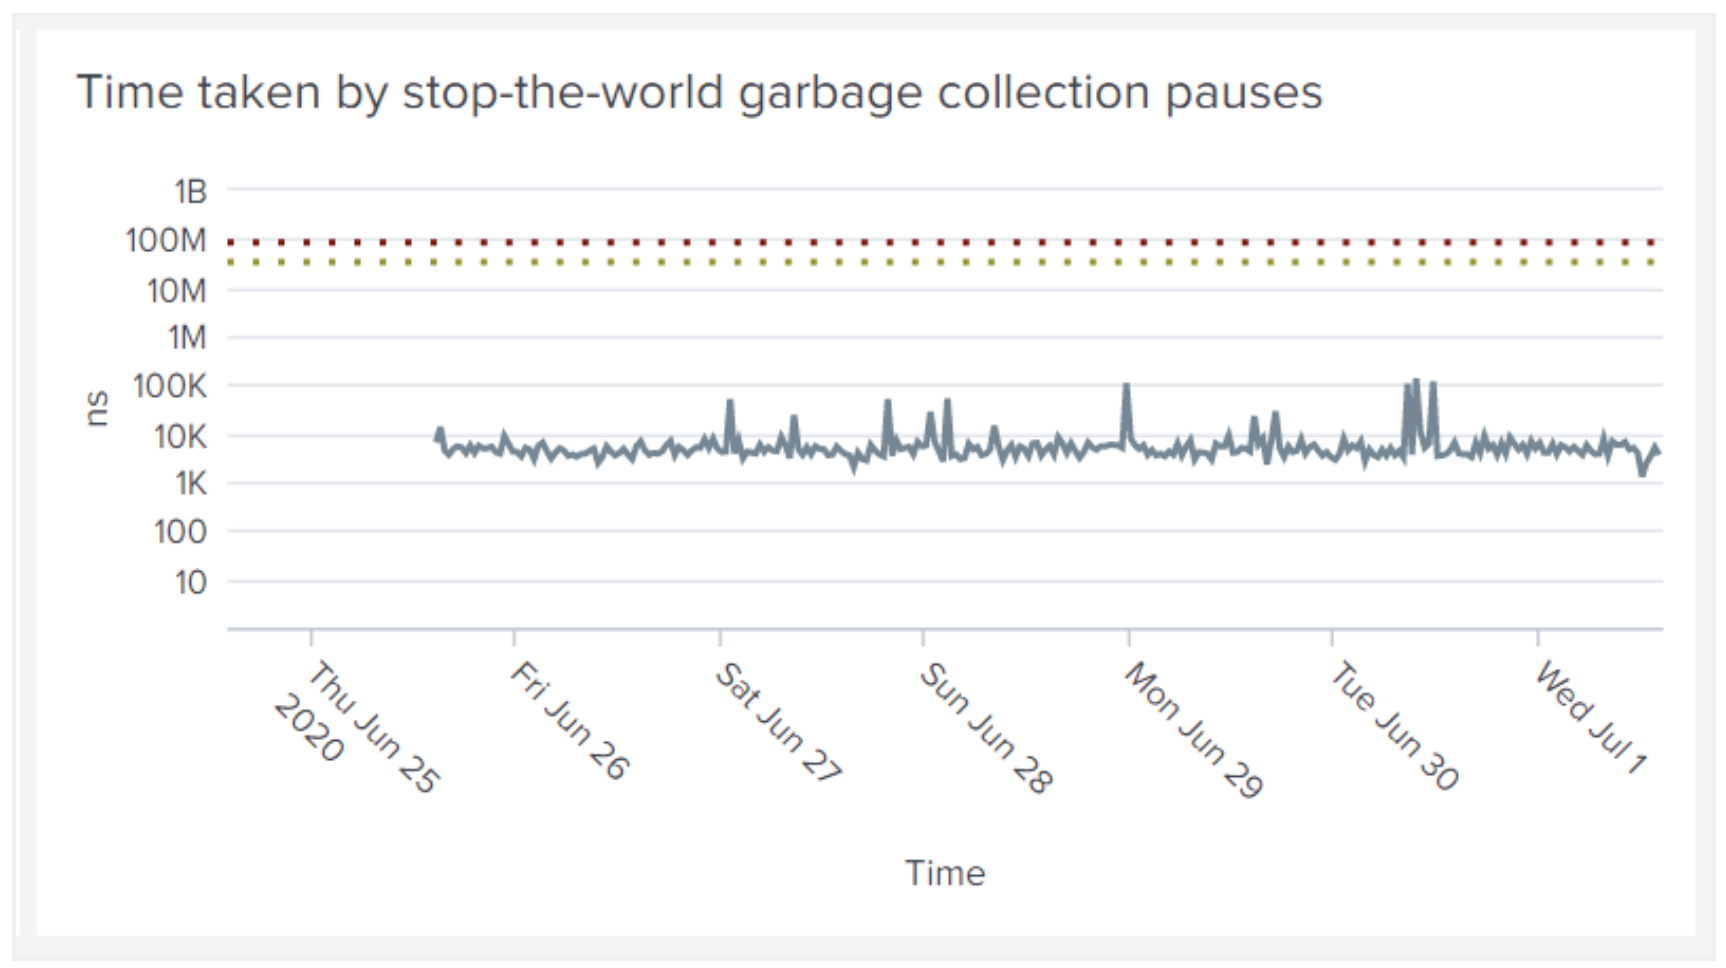
Image 5: Example metric visualized with threshold values
»Next Steps
The Splunk app is available with Vault Enterprise. However, all the data sources leveraged by the app are available with all versions of Vault. Also, step-by-step instructions on how to leverage Splunk to monitor Vault are provided in the Vault Monitor Telemetry and Audit Device Log Data with Splunk guide. These instructions, along with Vault’s data sources can be used to construct the Splunk dashboards from scratch.
Vault Enterprise users can complete the Splunk app request form to request access to the app.
Please note that this tutorial includes products which are not supported by HashiCorp Global support, in case of any issues related to non-HashiCorp products, please reach out to the respective vendors or communities for further assistance.
Sign up for the latest HashiCorp news
More blog posts like this one
Managing OpenAI API keys with HashiCorp Vault's dynamic secrets plugin
Secure AI credentials using dynamic, short-lived tokens that automatically expire.

Patterns for connecting Vault to Amazon RDS using Amazon VPC Lattice
Learn various ways of using Amazon VPC Lattice to achieve private connectivity from Vault to Amazon RDS without connecting VPCs using VPC peering or Transit Gateway.
Connecting Vault to Amazon RDS using Amazon VPC Lattice
See how Amazon VPC Lattice can help achieve private connectivity from Vault self-managed to Amazon RDS without connecting VPCs using VPC Peering or Transit Gateway.