

Collecting metrics and traces from your applications can help you monitor and debug your system. However, setting up and collecting telemetry often requires refactoring applications, standardizing telemetry formats, and identifying connectivity to observability systems. You can simplify your telemetry by standardizing on OpenTelemetry: a cross-company, CNCF-backed standard. OpenTelemetry has drop-in instrumentation for popular application frameworks and standardizes traces across different formats.
If you add application telemetry standardized by OpenTelemetry, you can combine metrics and traces with service mesh telemetry. By collecting telemetry from HashiCorp Consul service mesh, you can observe service-to-service communication across multiple environments through proxies. This blog post shows how to configure OpenTelemetry with Consul service mesh, Zipkin, Spring and ASP.NET apps, Jaeger, and Prometheus. It includes a concrete example using OpenTelemetry to simplify and standardize telemetry from applications and service mesh proxies.
»Service Mesh Telemetry
Service mesh proxies offer two forms of telemetry, metrics and traces. Both track requests and response codes for services through their proxies. However, tracing requires additional instrumentation in your application to support the propagation of trace context.
OpenTelemetry is a collection of tools, APIs, and SDKs for generating and exporting telemetry such as metrics and traces. It offers a standard to export metrics and traces in the format of your choice. In order to set up end-to-end tracing, you must configure OpenTelemetry to export traces with the same format as your service mesh proxies.
The example in this post adds the OpenTelemetry Prometheus and Zipkin exporters to .NET and Java applications on Kubernetes. The metrics and traces from applications get merged with telemetry from the service mesh and collected by Prometheus and Jaeger.
»Metrics
To enable service mesh proxy and application metrics, you need to configure Prometheus exporters for the proxy and the application. However, Prometheus cannot access the application’s metrics in a service mesh, because the service mesh does not expose the metrics address.
Instead, you need to configure the proxy to merge metrics from the application’s metrics endpoint with the proxy’s metrics. Metrics merging exposes the application and proxy metrics over the proxy’s metrics endpoint. In this section, you’ll learn to configure proxy and application metrics and enable metrics merging.
»Service Mesh
First, configure Consul service mesh to expose Envoy metrics to Prometheus or other metrics servers. If you want to enable Envoy metrics for all services, you can deploy Consul with global.metrics.enabled set to true in the Consul Helm chart values.
global:
  metrics:
    enabled: true
Alternatively, you can create a configuration entry for a proxy default and define the envoy_prometheus_bind_addr. The attribute exposes the Envoy metrics to the address and port of your choice, such as 0.0.0.0:20200, for Prometheus to scrape.
apiVersion: consul.hashicorp.com/v1alpha1
kind: ProxyDefaults
metadata:
 name: global
spec:
 config:
   envoy_prometheus_bind_addr: "0.0.0.0:20200"
Expose other metrics formats by referring to documentation on bootstrap configuration. When you deploy a service to the service mesh and scrape the Prometheus metrics endpoint at 127.0.0.1:20200/metrics, you get a set of Envoy metrics:
$ kubectl exec -it  -c envoy-sidecar -- wget -qO- 127.0.0.1:20200/metrics | head -n 10

# TYPE envoy_cluster_assignment_stale counter
envoy_cluster_assignment_stale{local_cluster="expense",consul_source_service="expense",consul_source_namespace="default",consul_source_partition="default",consul_source_datacenter="useast",envoy_cluster_name="expense-db-mssql",consul_destination_custom_hash="",consul_destination_service_subset="",consul_destination_service="expense-db-mssql",consul_destination_namespace="default",consul_destination_partition="",consul_destination_datacenter="useast",consul_destination_routing_type="internal",consul_destination_trust_domain="756fa1fd-a15a-904f-5f6c-b66c3b42f27b",consul_destination_target="expense-db-mssql.default.useast",consul_destination_full_target="expense-db-mssql.default.useast.internal.756fa1fd-a15a-904f-5f6c-b66c3b42f27b",consul_custom_hash="",consul_service_subset="",consul_service="expense-db-mssql",consul_namespace="default",consul_datacenter="useast",consul_routing_type="internal",consul_trust_domain="756fa1fd-a15a-904f-5f6c-b66c3b42f27b",consul_target="expense-db-mssql.default.useast",consul_full_target="expense-db-mssql.default.useast.internal.756fa1fd-a15a-904f-5f6c-b66c3b42f27b"} 0

## omitted for clarity
While the Envoy metrics include upstream and downstream connection information, you will likely want additional metrics tracking the number of transactions or time spent on certain code within your application. To supplement the proxy metrics, you can add additional instrumentation with OpenTelemetry to your application code. OpenTelemetry instrumentation provides detailed information specific to your application’s runtime environment.
For an ASP.NET application (.NET 6.0), add the OpenTelemetry packages and OpenTelemetry metrics settings in Program.cs. The settings add HTTP client and ASP.NET Core instrumentation with the Prometheus exporter. The exporter exposes metrics in Prometheus format.
using OpenTelemetry.Metrics;
using System.Reflection;

// omitted for clarity

var metricsEndpoint = builder.Configuration["MetricsEndpoint"] ?? "http://*:9464";

// omitted for clarity

builder.Services.AddOpenTelemetryMetrics(b =>
{
   b
   .AddHttpClientInstrumentation()
   .AddAspNetCoreInstrumentation()
   .AddPrometheusExporter(o =>
   {
       o.StartHttpListener = true;

       // Workaround for issue: https://github.com/open-telemetry/opentelemetry-dotnet/issues/2840
       o.GetType()
           ?.GetField("httpListenerPrefixes", BindingFlags.NonPublic | BindingFlags.Instance)
           ?.SetValue(o, new[] { metricsEndpoint });

       o.ScrapeResponseCacheDurationMilliseconds = 0;
   });
});
The Prometheus exporter specifies a few options, such as starting the HTTP listener and scraping metrics on-demand without caching. Furthermore, the example uses a workaround to bind the HTTP listener for the metrics endpoint to any interface on port 9464 (http://*:9464). This explicit binding allows the proxy to access the metrics endpoint when the application runs in a container.
For a Java application, download the OpenTelemetry agent. This JAR file automatically instruments a Java application without changing code. The example copies the agent to the application’s container and runs the agent as part of the application’s entry point. The entrypoint also sets the -Dotel.metrics.exporter option to prometheus. By default, the agent exposes application metrics on port 9464.
FROM gradle:7.4-jdk11 AS build
COPY --chown=gradle:gradle . /home/gradle/src
WORKDIR /home/gradle/src
RUN gradle clean build --no-daemon

FROM openjdk:11-jre-slim
EXPOSE 8080
RUN mkdir -p /app/agent
COPY --from=build /home/gradle/src/build/libs/*.jar /app/spring-boot-application.jar
COPY --from=build /home/gradle/src/application.properties /app/application.properties
COPY --from=build /home/gradle/src/agent/opentelemetry-javaagent.jar /app/agent/opentelemetry-javaagent.jar
ENTRYPOINT ["java", "-XX:+UseContainerSupport", "-Djava.security.egd=file:/dev/./urandom", "-Dotel.metrics.exporter=prometheus", "-javaagent:/app/agent/opentelemetry-javaagent.jar", "-Dotel.resource.attributes=service.name=expense", "-jar","/app/spring-boot-application.jar"]
The instrumentation added to the ASP.NET and Spring Boot applications track HTTP server durations, requests, and other metrics. To add custom metrics, refer to .NET documentation or manual instrumentation for Java.
»Metrics Merging
If you want to merge metrics for all services, you can omit the annotation from each application by deploying Consul with connectInject.metrics.defaultEnableMerging set to true in the Consul Helm chart values.
connectInject:
  metrics:
    defaultEnableMerging: true
Alternatively, you can customize metrics merging per service by annotating the deployment. Set the consul.hashicorp.com/enable-metrics-merging annotation to true. Add the consul.hashicorp.com/service-metrics-port annotation to tell the proxy which port it should use to retrieve metrics from the application. This example exposes application metrics for both .NET and Java applications on port 9464:
apiVersion: apps/v1
kind: Deployment
metadata:
  name: expense
  labels:
    app: expense
    release: v1
spec:
  replicas: 1
  selector:
    matchLabels:
      app: expense
      release: v1
  template:
    metadata:
      annotations:
        prometheus.io/scrape: "true"
        consul.hashicorp.com/connect-inject: "true"
        consul.hashicorp.com/enable-metrics-merging: "true"
        consul.hashicorp.com/service-metrics-port: "9464"
After deploying the application, retrieve the metrics from the proxy’s metrics endpoint on 127.0.0.1:20200/metrics. The endpoint includes a set of application metrics and a gauge for consul_merged_service_metrics_success. The gauge shows a value of 1 if Consul successfully merged the metrics from the application to the proxy metrics endpoint:
$ kubectl exec -it  -c envoy-sidecar -- wget -qO- 127.0.0.1:20200/metrics | tail -n 10

http_server_duration_ms_bucket{http_flavor="HTTP/1.1",http_method="GET",http_scheme="http",http_status_code="200",le="50"} 210 1650474682750
http_server_duration_ms_bucket{http_flavor="HTTP/1.1",http_method="GET",http_scheme="http",http_status_code="200",le="75"} 210 1650474682750
http_server_duration_ms_bucket{http_flavor="HTTP/1.1",http_method="GET",http_scheme="http",http_status_code="200",le="100"} 210 1650474682750
http_server_duration_ms_bucket{http_flavor="HTTP/1.1",http_method="GET",http_scheme="http",http_status_code="200",le="250"} 211 1650474682750
http_server_duration_ms_bucket{http_flavor="HTTP/1.1",http_method="GET",http_scheme="http",http_status_code="200",le="500"} 211 1650474682750
http_server_duration_ms_bucket{http_flavor="HTTP/1.1",http_method="GET",http_scheme="http",http_status_code="200",le="1000"} 211 1650474682750
http_server_duration_ms_bucket{http_flavor="HTTP/1.1",http_method="GET",http_scheme="http",http_status_code="200",le="+Inf"} 211 1650474682750
http_server_duration_ms_sum{http_flavor="HTTP/1.1",http_method="GET",http_scheme="http",http_status_code="200"} 187.2244 1650474682750
http_server_duration_ms_count{http_flavor="HTTP/1.1",http_method="GET",http_scheme="http",http_status_code="200"} 211 1650474682750
consul_merged_service_metrics_success 1
With metrics merging, Prometheus only needs to scrape the proxy metrics endpoint to retrieve proxy and application metrics.
»Tracing
Distributed tracing tracks activity during a request to an application. Tracing uses spans to reflect the time for specific activities such as connection requests or API queries to complete between services or within application code. However, tracing requires the propagation of context to properly track activity. You will not obtain service mesh traces by default unless you include tracing instrumentation in your application. Therefore, you must add OpenTelemetry instrumentation to your application to enable tracing. This example configures OpenTelemetry to export traces as Zipkin spans for backwards compatibility with Envoy versions and HTTP tracers. In this section, you’ll learn how to configure tracing for the service mesh and applications to correctly propagate context for traces.
»Service Mesh
Next, configure Consul service mesh to track Envoy traces as Zipkin spans. The example uses Jaeger to collect and organize the spans. Jaeger maintains backwards compatibility with Zipkin. While Envoy supports other tracing formats, this example uses Zipkin as a common tracing format across all applications.
In Consul’s proxy default configuration entry, set up Envoy tracers in envoy_tracing_json and envoy_extra_static_clusters_json. The proxies enable the Zipkin tracer and sends all spans to a collector; a static cluster pointing to Jaeger:
apiVersion: consul.hashicorp.com/v1alpha1
kind: ProxyDefaults
metadata:
 name: global
spec:
 config:
   envoy_prometheus_bind_addr: "0.0.0.0:20200"
   envoy_tracing_json: |
     {
       "http": {
         "name": "envoy.tracers.zipkin",
         "typedConfig": {
           "@type": "type.googleapis.com/envoy.config.trace.v3.ZipkinConfig",
           "collector_cluster": "jaeger_9411",
           "collector_endpoint_version": "HTTP_JSON",
           "collector_endpoint": "/api/v2/spans",
           "shared_span_context": true
         }
       }
     }
   envoy_extra_static_clusters_json: |
     {
       "name": "jaeger_9411",
       "type": "STRICT_DNS",
       "connect_timeout": "5s",
       "load_assignment": {
         "cluster_name": "jaeger_9411",
         "endpoints": [
           {
             "lb_endpoints": [
               {
                 "endpoint": {
                   "address": {
                     "socket_address": {
                       "address": "jaeger.default.svc.cluster.local",
                       "port_value": 9411
                     }
                   }
                 }
               }
             ]
           }
         ]
       }
     }
To set up other tracers, review the Consul documentation for distributed tracing.
»Applications
If you make a request to an application in the service mesh, you will not find traces from the proxies in Jaeger. You must instrument your application with OpenTelemetry to propagate trace metadata. Enabling OpenTelemetry traces ensures that the application captures spans from proxies and passes the metadata to other applications.
For an ASP.NET application (.NET 6.0), add the OpenTelemetry packages and OpenTelemetry tracing settings in Program.cs. The settings add SQL client, HTTP client, and ASP.NET Core instrumentation with the Zipkin exporter. The exporter sends traces in Zipkin format to Jaeger’s Zipkin endpoint.
using OpenTelemetry.Resources;
using OpenTelemetry.Trace;

// omitted for clarity

var serviceName = builder.Configuration.GetValue("Name");
var serviceVersion = builder.Configuration.GetValue("Version");

var tracingUri = builder.Configuration["Zipkin"] ?? "http://localhost:9411/api/v2/spans";

// omitted for clarity

builder.Services.AddOpenTelemetryTracing(b =>
{
   b
   .AddSource(serviceName)
   .SetResourceBuilder(
       ResourceBuilder.CreateDefault()
           .AddService(serviceName: serviceName, serviceVersion: serviceVersion))
   .AddSqlClientInstrumentation(o =>
   {
       o.SetDbStatementForText = true;
   })
   .AddHttpClientInstrumentation()
   .AddAspNetCoreInstrumentation()
   .AddZipkinExporter(o =>
   {
       o.Endpoint = new Uri(tracingUri);
   });
});
You can use a different exporter in your application, such as Jaeger. However, your Envoy tracer must match the tracing format. Otherwise, you will not have continuity in spans.
For a Java application, download the OpenTelemetry agent. Similar to the metrics configuration, add the -Dotel.traces.exporter=zipkin option to the application’s JAR file command to automatically enable the OpenTelemetry Zipkin exporter:
FROM gradle:7.4-jdk11 AS build
COPY --chown=gradle:gradle . /home/gradle/src
WORKDIR /home/gradle/src
RUN gradle clean build --no-daemon

FROM openjdk:11-jre-slim
EXPOSE 8080
RUN mkdir -p /app/agent
COPY --from=build /home/gradle/src/build/libs/*.jar /app/spring-boot-application.jar
COPY --from=build /home/gradle/src/application.properties /app/application.properties
COPY --from=build /home/gradle/src/agent/opentelemetry-javaagent.jar /app/agent/opentelemetry-javaagent.jar
ENTRYPOINT ["java", "-XX:+UseContainerSupport", "-Djava.security.egd=file:/dev/./urandom", "-Dotel.traces.exporter=zipkin", "-javaagent:/app/agent/opentelemetry-javaagent.jar", "-Dotel.resource.attributes=service.name=expense", "-jar","/app/spring-boot-application.jar"]
The OpenTelemetry agent for Java allows additional configuration of the exporter with environment variables. Since the example application runs on Kubernetes, create an environment variable in the deployment for OTEL_EXPORTER_ZIPKIN_ENDPOINT and set the value to Jaeger’s Zipkin endpoint:
---
apiVersion: apps/v1
kind: Deployment
metadata:
 name: expense-v2
 labels:
   app: expense
   release: v2
spec:
 replicas: 1
 selector:
   matchLabels:
     app: expense
     release: v2
 Template:

 ## omitted for clarity

   spec:
     serviceAccountName: expense-v2
     containers:
       - name: expense
         image: "joatmon08/expense:java-2.6.5"
         ports:
           - containerPort: 80
         env:
           - name: OTEL_EXPORTER_ZIPKIN_ENDPOINT
             value: "http://jaeger:9411/api/v2/spans"
By setting the application to enable Zipkin traces by default, you automatically start traces each time you run the application. You can use environment variables to further customize the trace collector endpoint depending on your environment.
If you have additional downstream services, such as an API gateway, you will need to enable a tracing format compatible with your application’s and proxy’s tracing formats. The example for this post includes a Kong API gateway configured with a Zipkin plugin and a default header_type of W3C:
apiVersion: configuration.konghq.com/v1
kind: KongPlugin
metadata:
 name: tracing
 annotations:
   kubernetes.io/ingress.class: kong
config:
 http_endpoint: http://jaeger.default.svc.cluster.local:9411/api/v2/spans
 sample_ratio: 1
 header_type: w3c
plugin: zipkin
OpenTelemetry uses W3C as a universal tracing context propagation standard. A request through a downstream service like an API gateway will have propagation headers compatible with upstream services using Zipkin or other tracing formats.
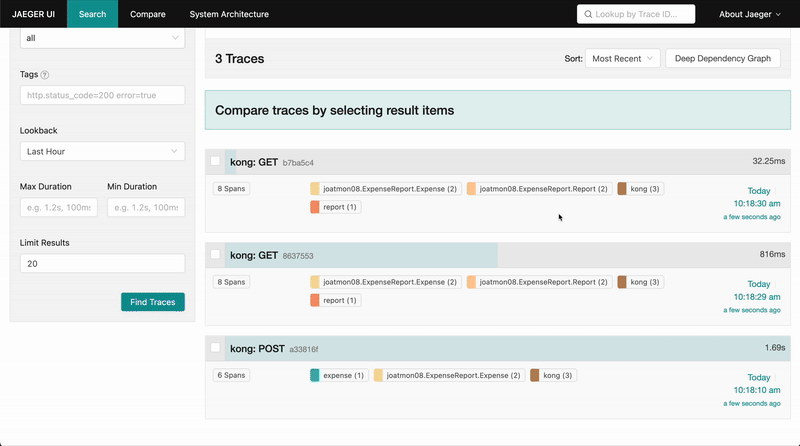
If you set up tracing instrumentation for each service and proxy, you will properly enable tracing for requests in your service mesh. For this example, make a request to the report service through the API gateway. In Jaeger, trace the request from the kong gateway to the report proxy and into the application request from report to expense. The traces even include database statement information for the call to the expense database.
»Conclusion
OpenTelemetry instrumentation offers metrics and tracing with the addition of a code library or agent to application code. This post shows how to add OpenTelemetry to .NET and Java applications. You can also include OpenTelemetry instrumentation in other programming languages and frameworks. Combining the telemetry from the application with those from Consul service mesh enables observability of requests and interactions between services.
As you build instrumentation in your applications, make sure you use consistent metrics and tracing formats. You can turn on Consul metrics merging to expose application metrics with proxy metrics. Similarly, you can set Envoy tracers compatible with your application’s tracing format, such as Zipkin.
For more detailed configuration, review the example’s code repository. OpenTelemetry documentation includes instructions on instrumenting different programming frameworks. Refer to Consul documentation to configure tracing or metrics in service mesh. Learn more about observability with Prometheus, Grafana, and Kubernetes with our Layer 7 observability tutorial.
Questions about this post? Add them to the community forum!


