

Configuring and managing a service mesh is complex, involving a series of steps to set up proxies and upstreams correctly. HashiCorp Consul users have relied on error logs and command line output to be able to troubleshoot the Consul service mesh, but Consul 1.9 introduces a new approach. Our new topology diagram helps users visualize and troubleshoot mesh connections and key metrics. In this blog post, we'll walk through an example that illustrates how to use the new topology diagram feature to effectively debug and visualize a service mesh.
»Configuring a Service Mesh
To set up Consul as a service mesh, start by enabling connect on Consul servers. Then, add a connect stanza to each service. This tells Consul to configure a sidecar proxy for this service. Next, start the proxies for each service. Then add upstreams to each service to identify each service’s dependencies.
Finally, write intentions between services that should be allowed to connect. In production, your default policy should be set to deny, so you should need to explicitly set intentions for each connection you want to allow.
»View the Topology Diagram
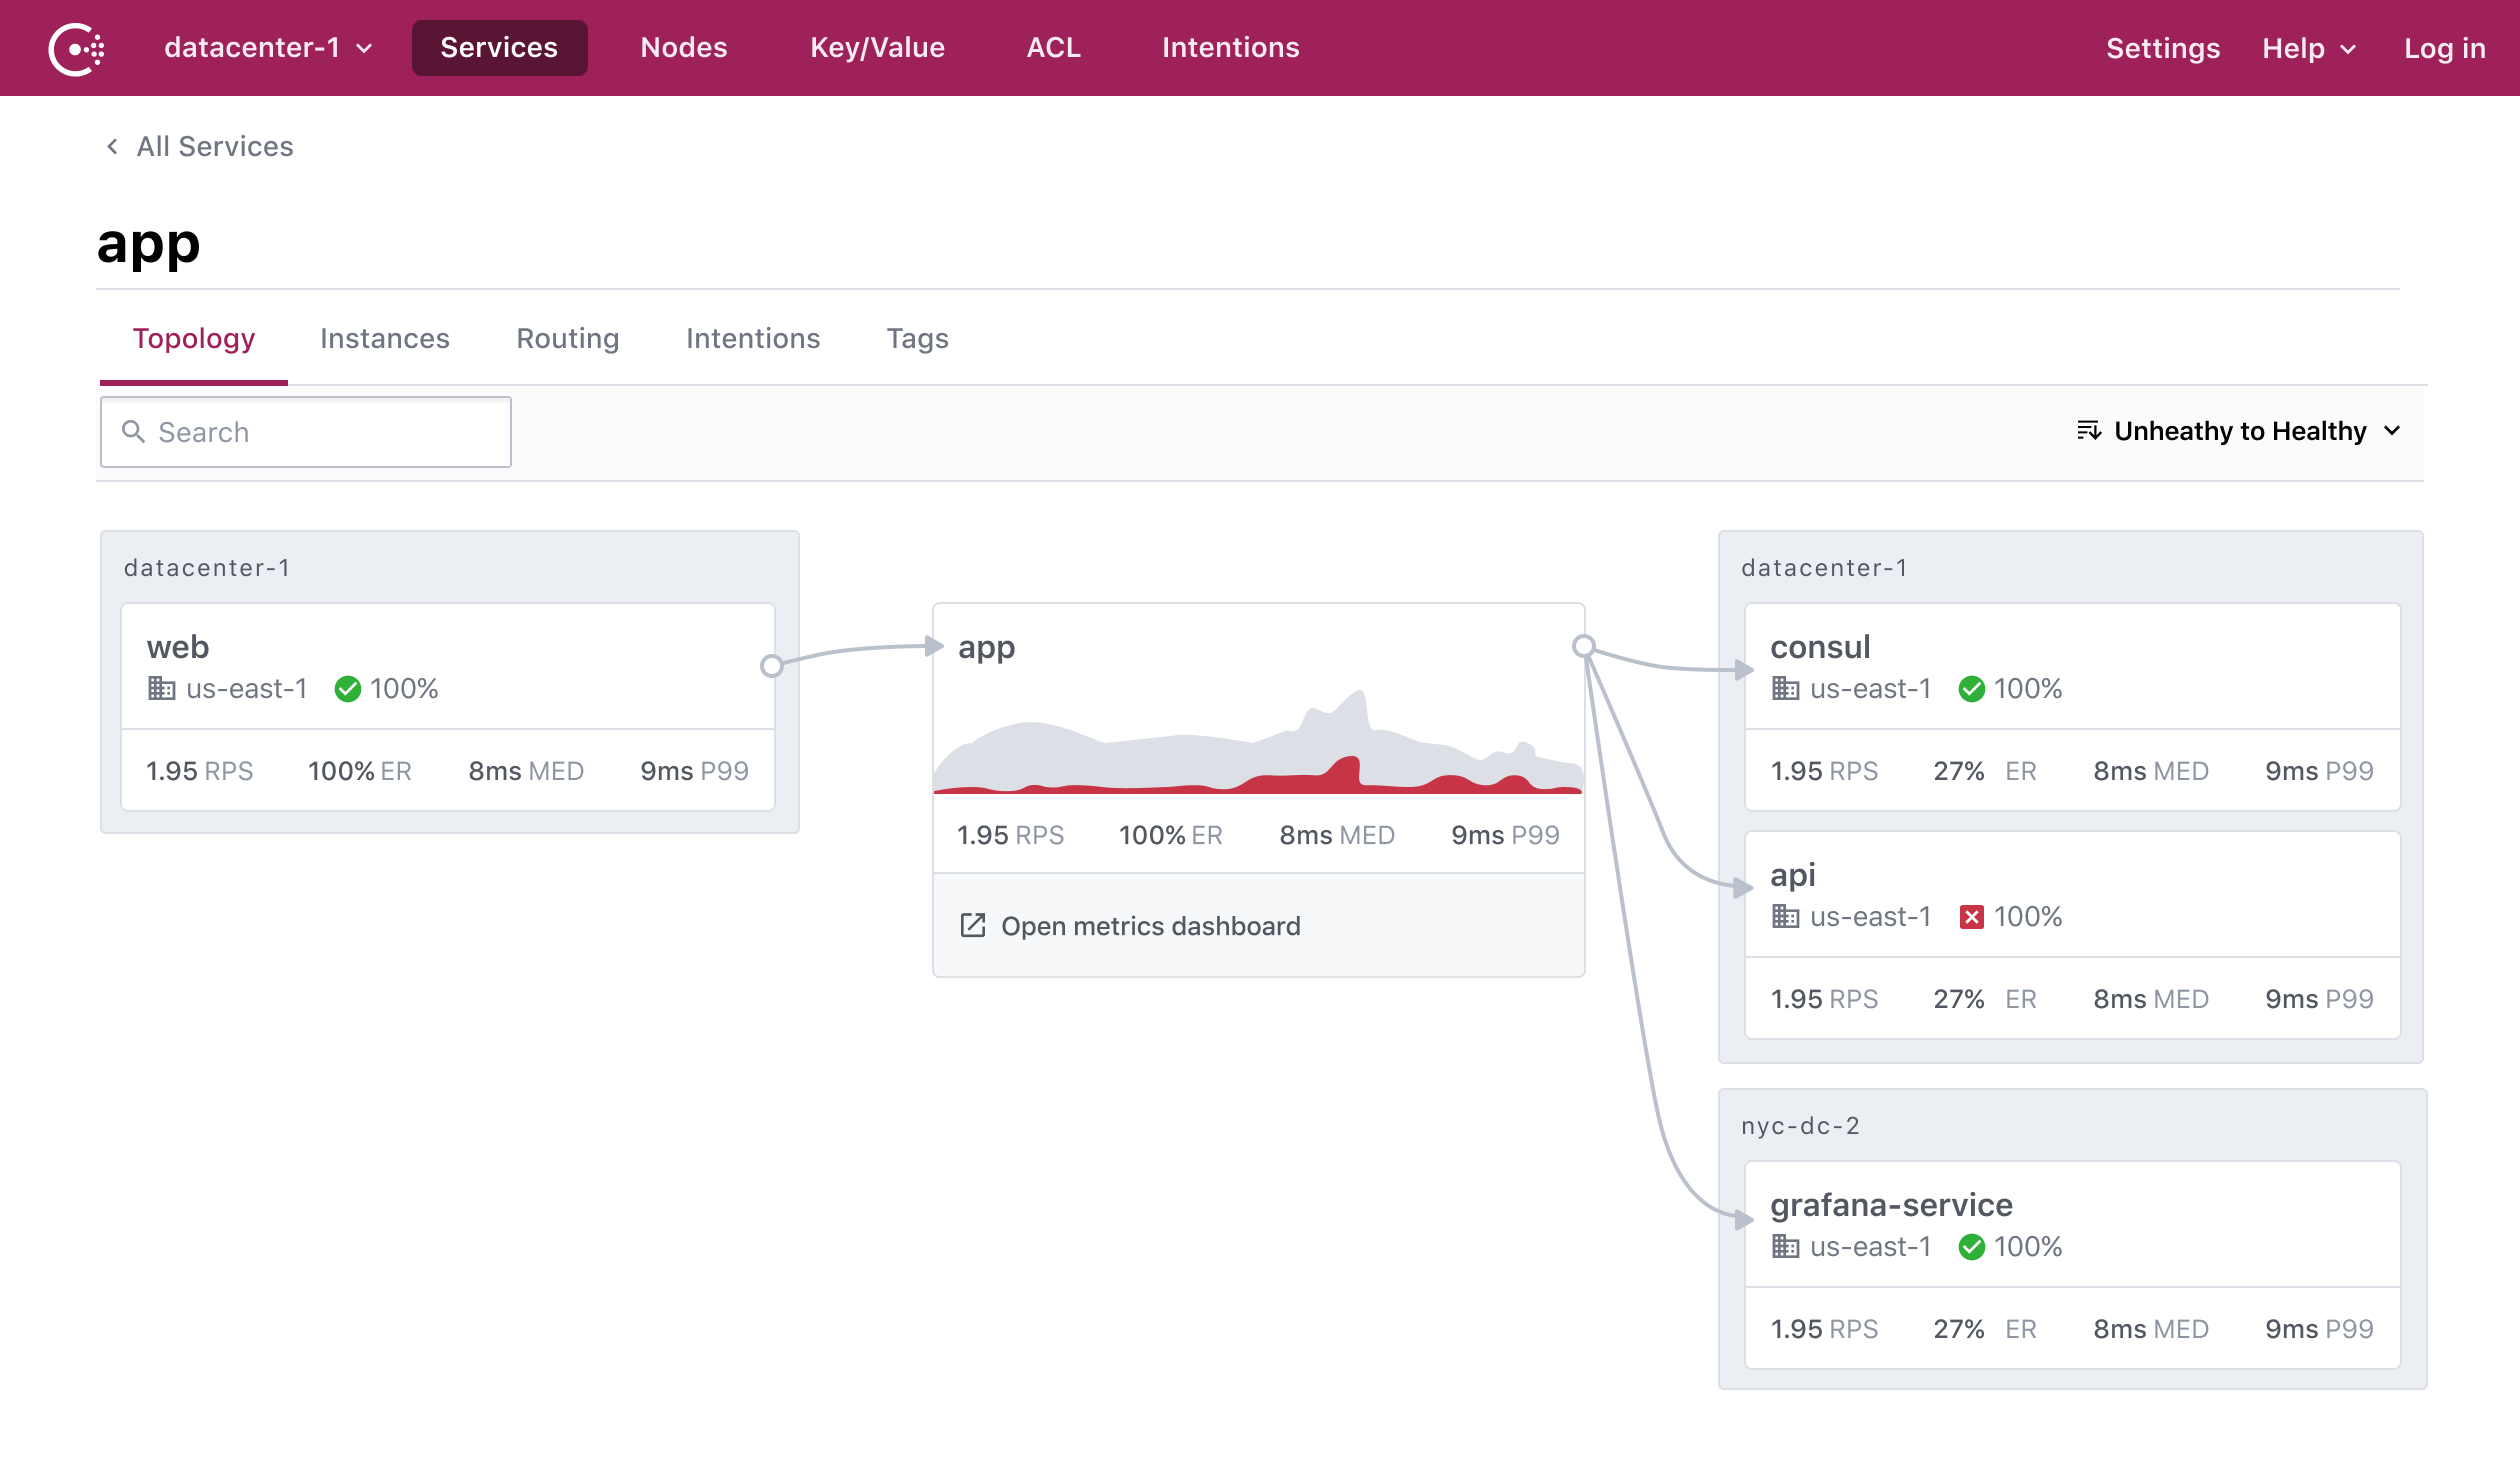
Now that you‘ve configured your service mesh, how can you tell if you’ve set it up properly? In Consul 1.9.0, we’re introducing a new topological diagram that will help you visualize the connections in your service mesh.
In the Consul UI, from the services page, navigate to a service. In this example, we’ll use the app service. As long as you have connect enabled, you’ll be able to see a Topology tab, which will show which services can connect to app (downstreams), and which services app can connect to (upstreams).
»Troubleshooting with the Visualization
This visualization is great for understanding the authorized connections between services and can also be helpful for troubleshooting when there are service communication failures. To get started troubleshooting, we want to provide a couple common failure scenarios and how to resolve them.
First, if you aren't seeing the services you expected in the diagram, we recommend checking that the service's upstreams are configured properly by reviewing the service definition.
curl $CONSUL_HTTP_ADDR/v1/catalog/service/app-sidecar-proxy | jq '.[0].ServiceProxy'

{
  "DestinationServiceName": "app",
  "DestinationServiceID": "app-app",
  "LocalServiceAddress": "127.0.0.1",
  "LocalServicePort": 9002,
  "Config": {
    "envoy_prometheus_bind_addr": "0.0.0.0:9102",
    "protocol": "http"
  },
  "Upstreams": [
    {
      "DestinationType": "service",
      "DestinationName": "api",
      "Datacenter": "",
      "LocalBindPort": 9001,
      "Config": {
        "protocol": "http"
      },
      "MeshGateway": {}
    }
  ],
  "MeshGateway": {},
  "Expose": {}
}
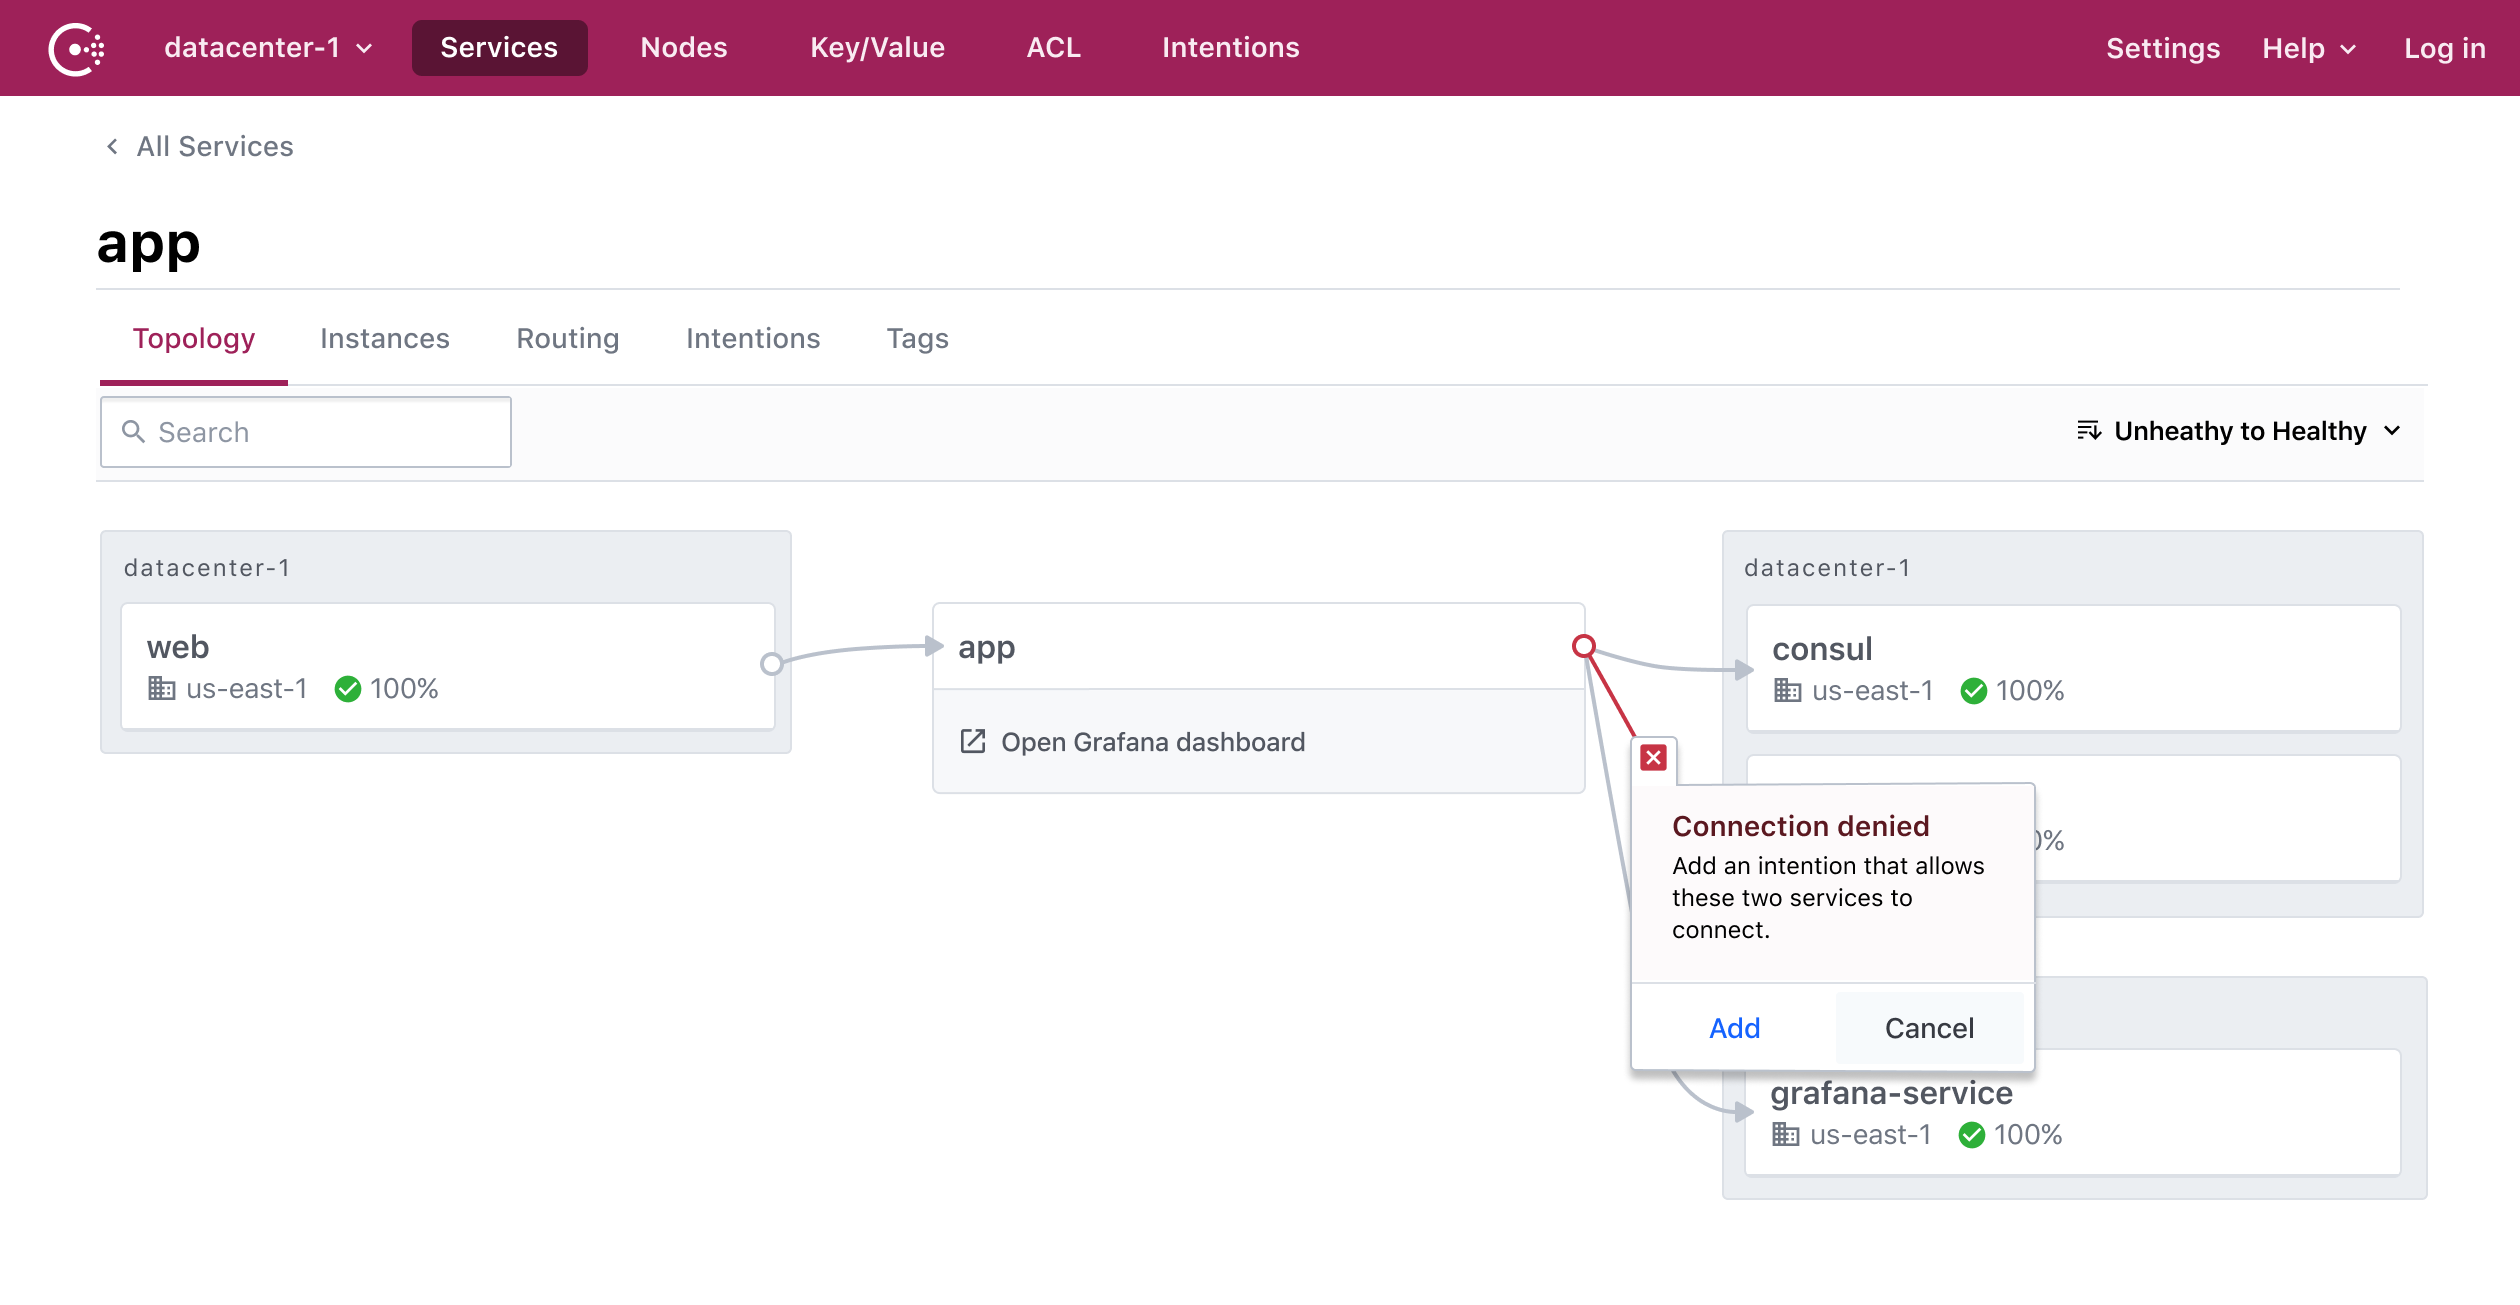
Second, if there is a red line and red icon on the connection, you may have a deny intention between the service and its upstream.
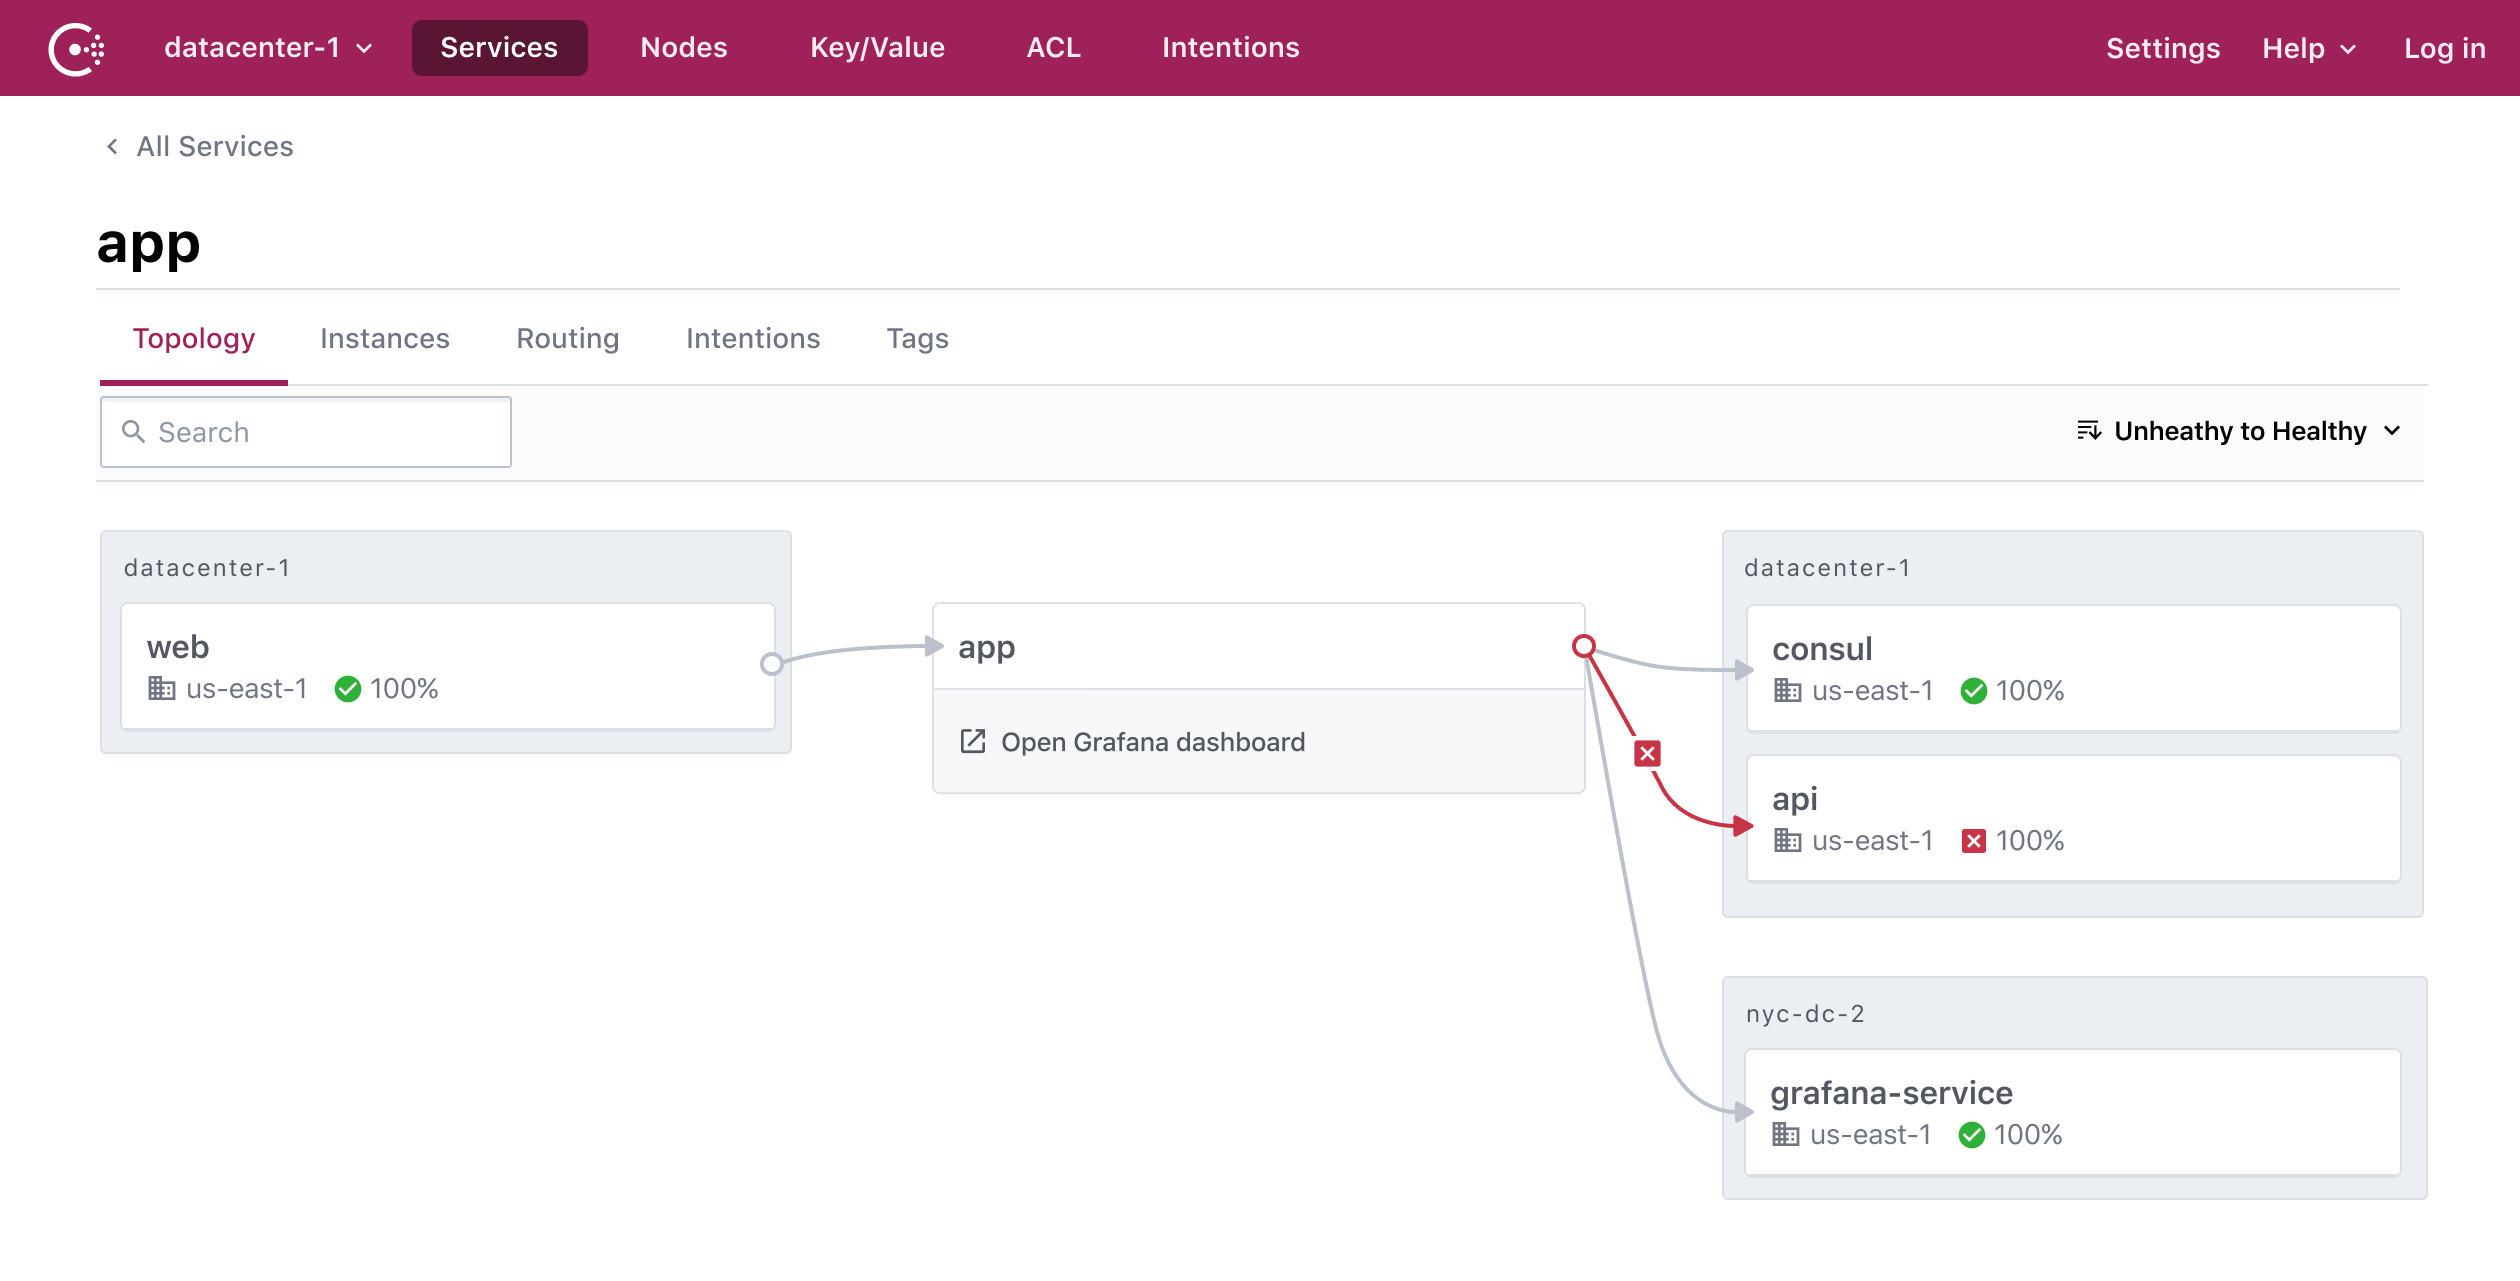
If you hover over that red icon, you’ll see an option to fix the connection by adding an allow intention.
»Metrics
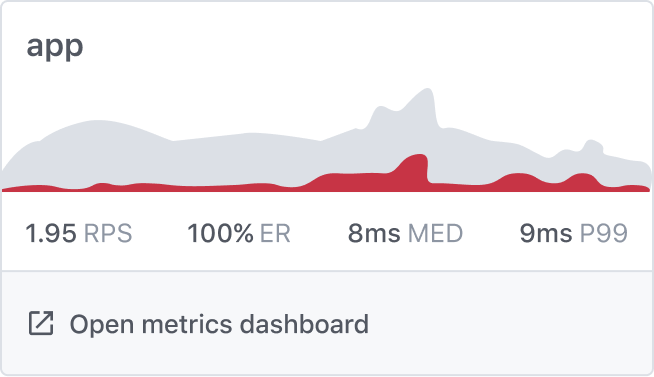
Finally, you can use this service mesh visualization to see a few basic metrics. There are two ways to add metrics to the mesh topology diagram. One way is to configure Prometheus to integrate with the Consul UI. With this integration, you can see stats like request rate, error rate, and latency for your service and its adjacent connections.
To set this up, add a ui_config stanza to the agent config file, with metrics provider details:
ui_config {
 enabled = true


 metrics_provider = "prometheus"
 metrics_provider_files  = ["/local/path/to/prometheus-provider.js"]
}
The second way to add metrics to the mesh topology diagram is to add a custom metrics link to the agent config file. While this won’t show data directly on Consul’s topology diagram, it will provide your team with a metrics link on the diagram for each service in Consul. This way, operators and developers will be able to troubleshoot problems quickly from Consul by clicking the accessible link right from the service detail page.
To set this up, add a dashboard template URL into that ui_config stanza in your agent config file (see docs).
ui_config {
  enabled = true
  dashboard_url_templates {
    service = "https://grafana.example.com/d/lDlaj-NGz/
      service-overview?orgId=1&var-service={{Service.Name}}&
      var-namespace={{Service.Namespace}}&var-dc={{Datacenter}}"
  }
}
»Getting Started
Consul’s new mesh topology diagram helps users visualize and troubleshoot their service mesh configurations. To learn more and get started with Consul Enterprise or request a free trial, visit the Consul product page.


