Replication is a Vault enterprise feature, with two use cases: Disaster Recovery (DR) and Performance. Its core unit is a Vault cluster; in replication, there is a primary cluster linked to a series of follower secondaries, and these clusters communicate in a one-to-many near real-time flow. Disaster Recovery replication is meant to protect against a failure of entire clusters, while performance replication is built to distribute a high-volume workload.
In both instances, it is important to be able to monitor the health of both the primary and secondary clusters, be made aware of potential issues and ways to address those issues, and note the connections between clusters. In Vault 1.5, we redesigned the replication UI to create dashboards that are easy to read, and make problems easier to see and troubleshoot. We are excited to share our redesigned dashboards with you.
»What changed and why?
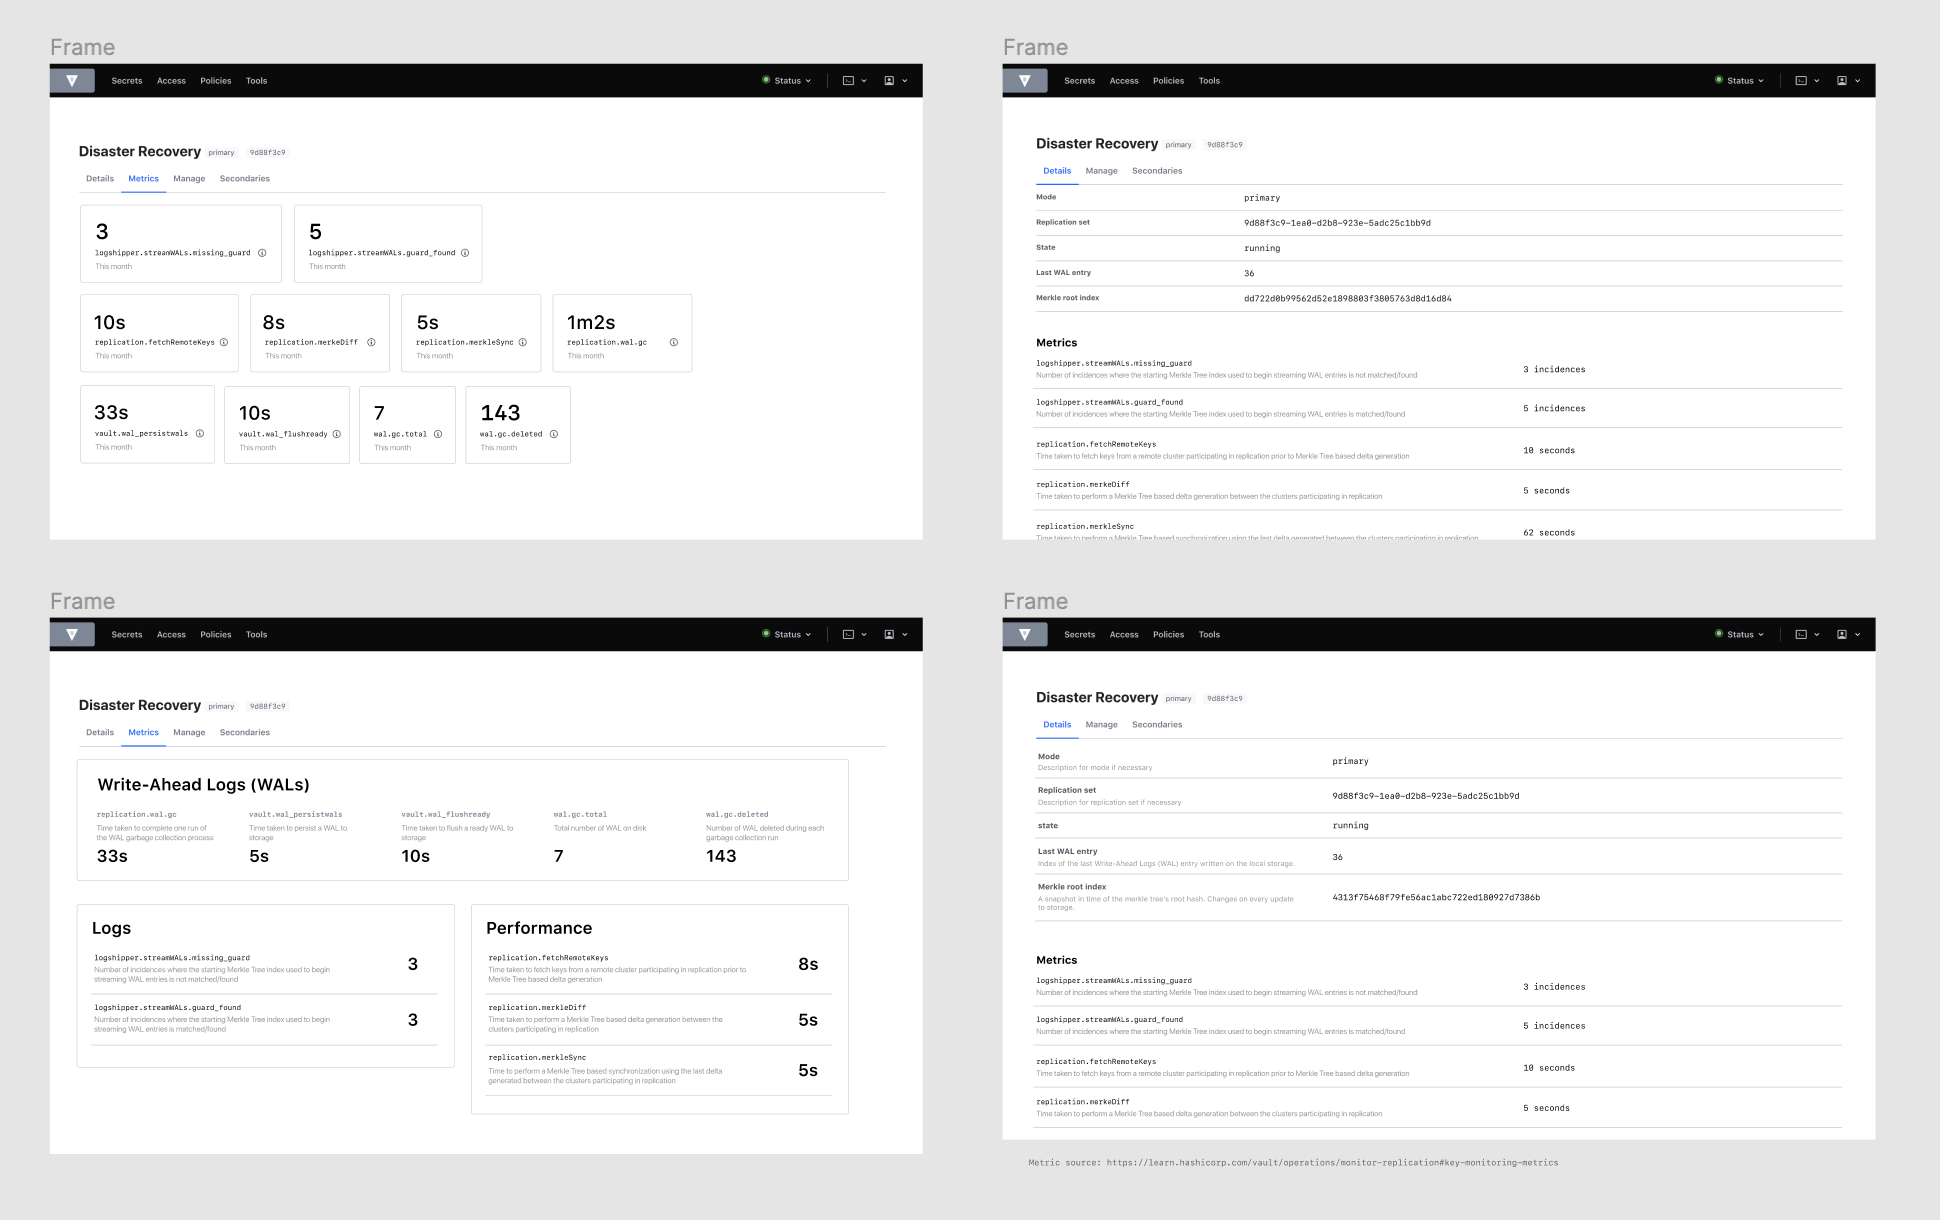
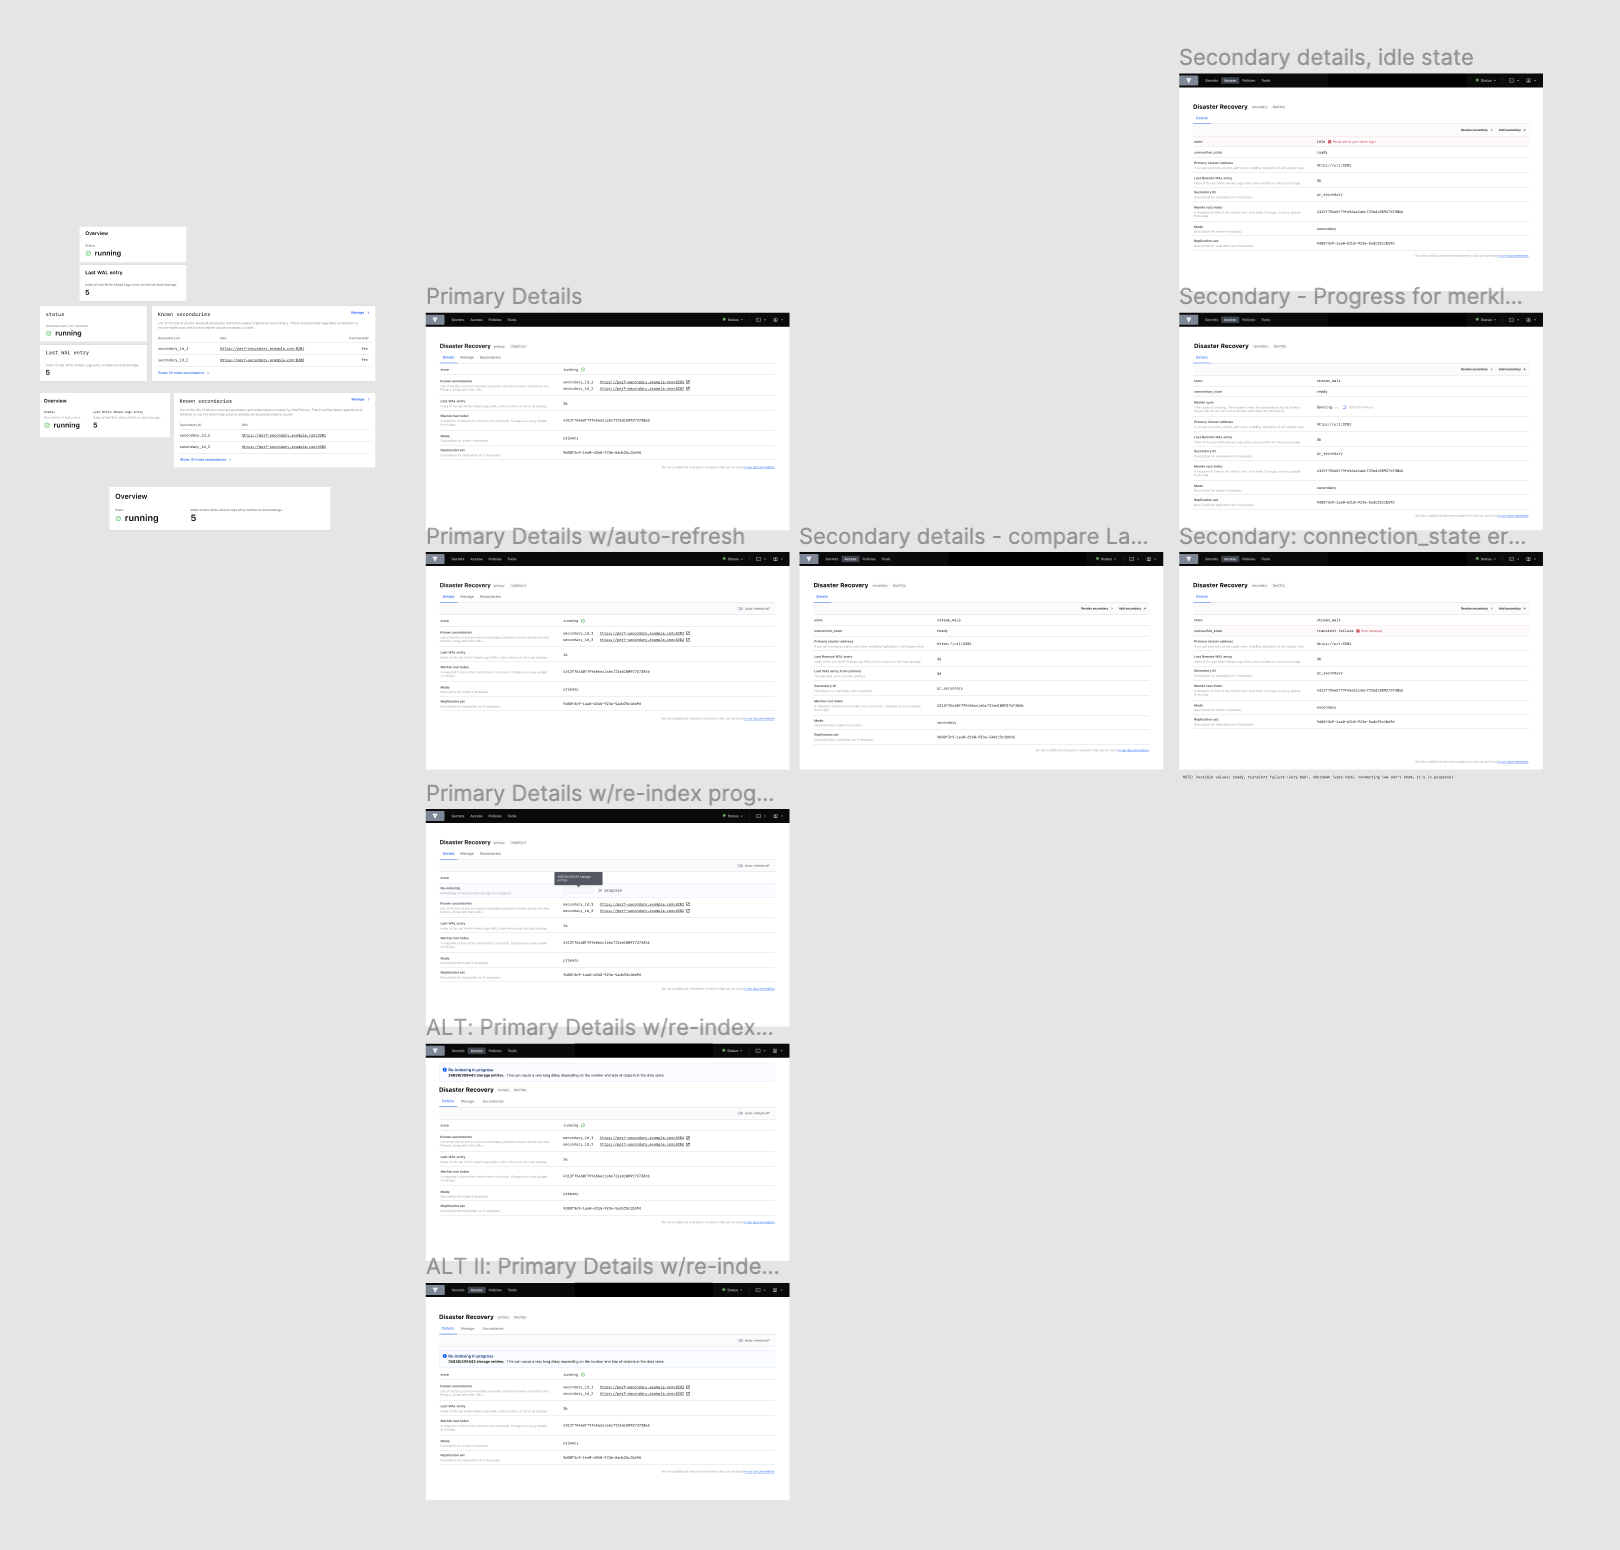
In the images below, the old replication UI is on the top, and the new UI on the bottom for a Disaster Recovery (DR) primary:
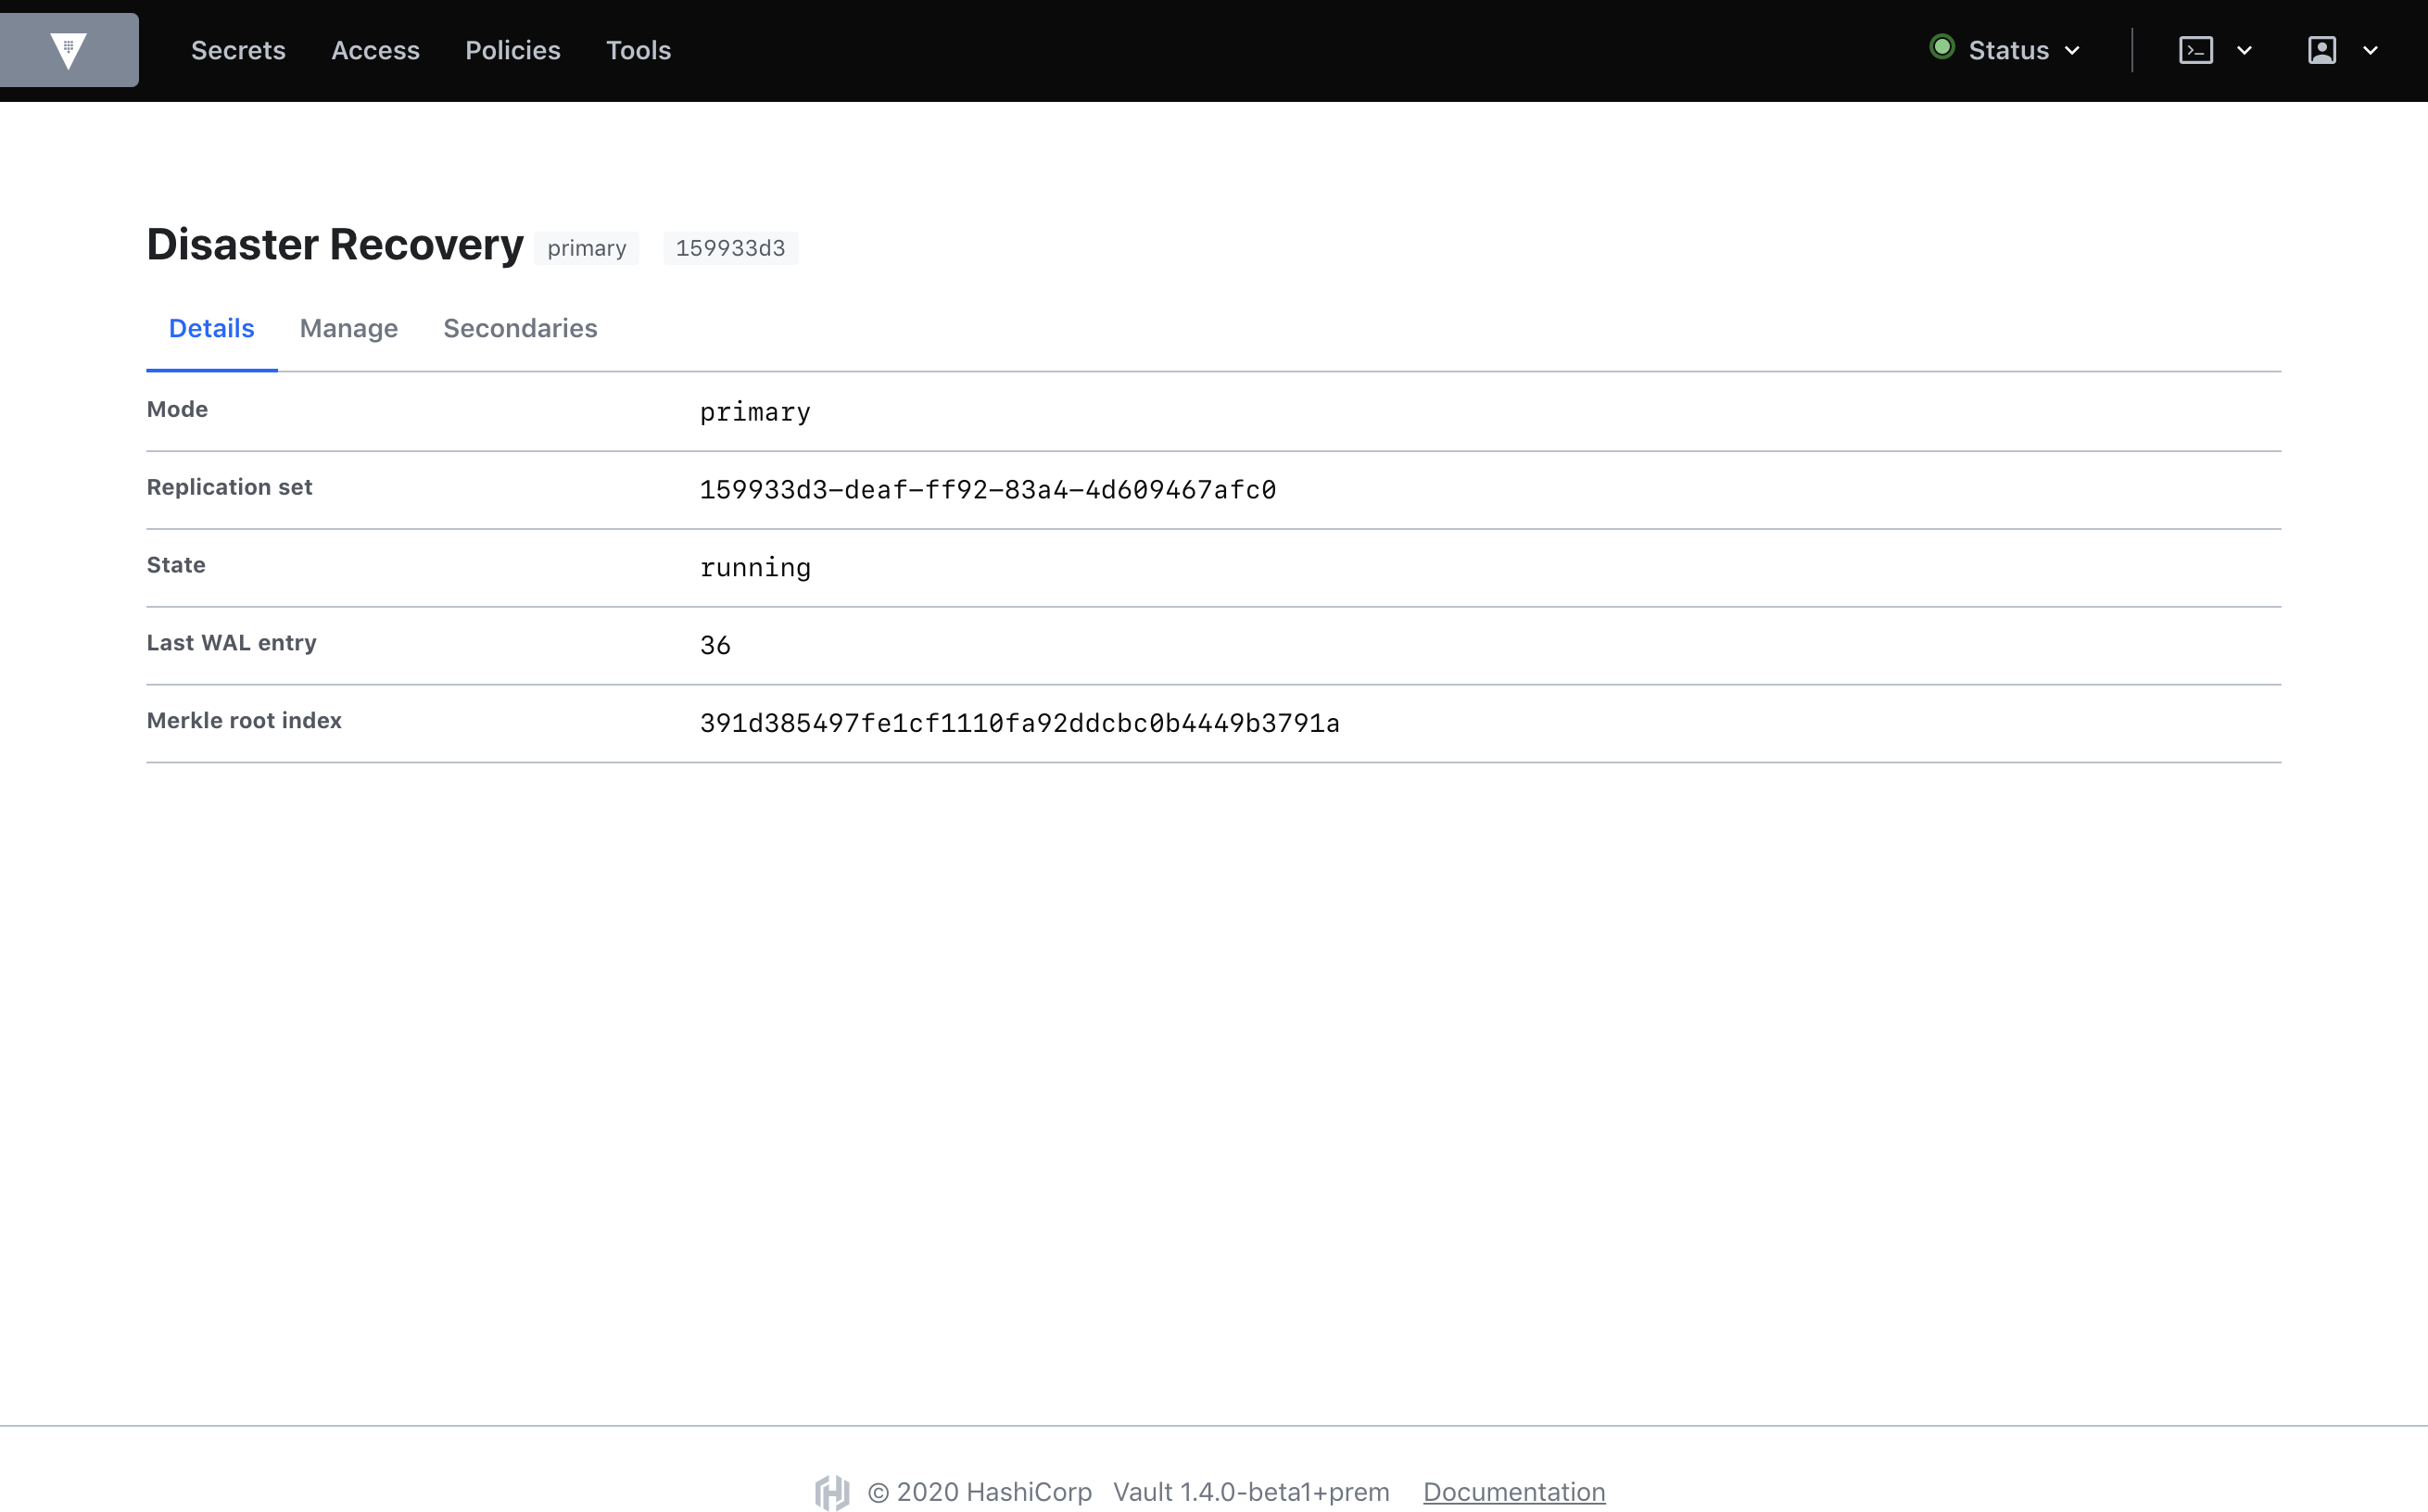
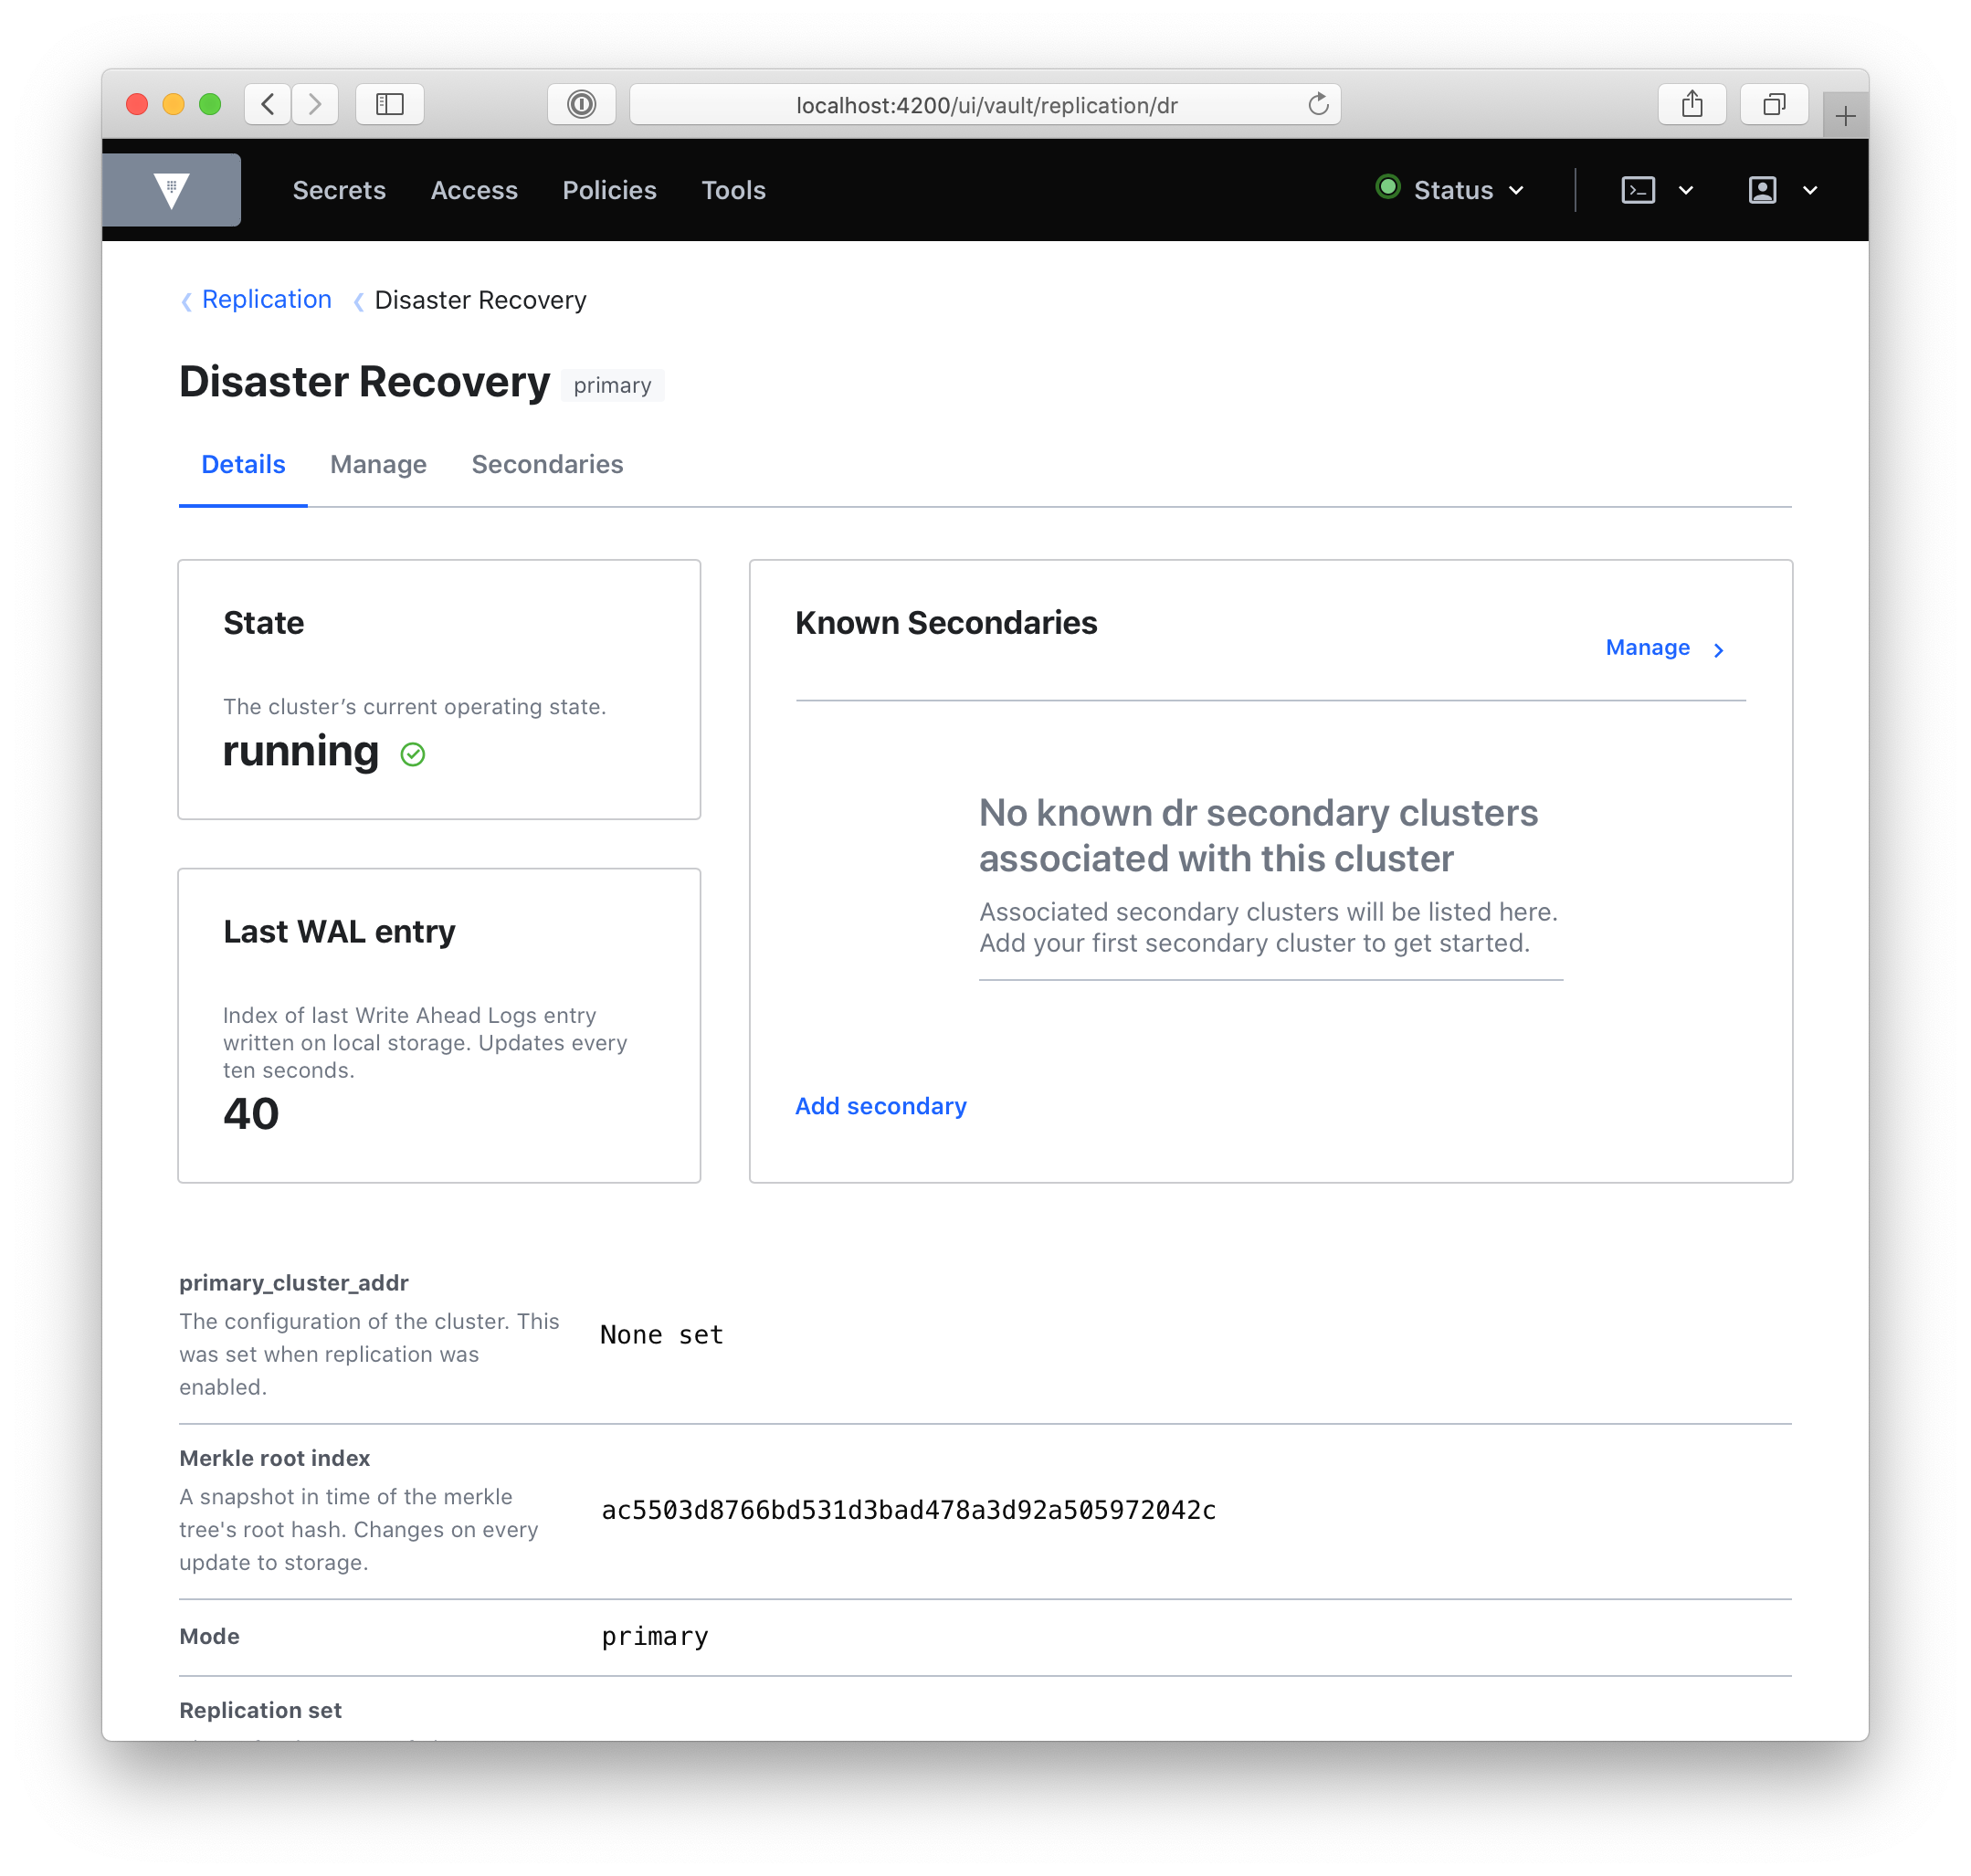
As you can see, there are quite a few visual changes and a lot of new information. A quick rundown of the DR primary dashboard:
- We’ve placed state, last_wal, and known_secondaries in cards. This information is important to scan at first glance, so we’ve placed it at the top of the page. They refer to the cluster’s current operating state, the last Write-Ahead Log entry written on local storage, and a list of the DR secondary clusters associated with the primary respectively.
- We’ve added new information: secondary ids, secondary URLs, and whether or not that secondary is connected. There is also the primary_cluster_addr if you’ve defined it.
- We’ve added descriptions, to define each value and clarify its purpose.
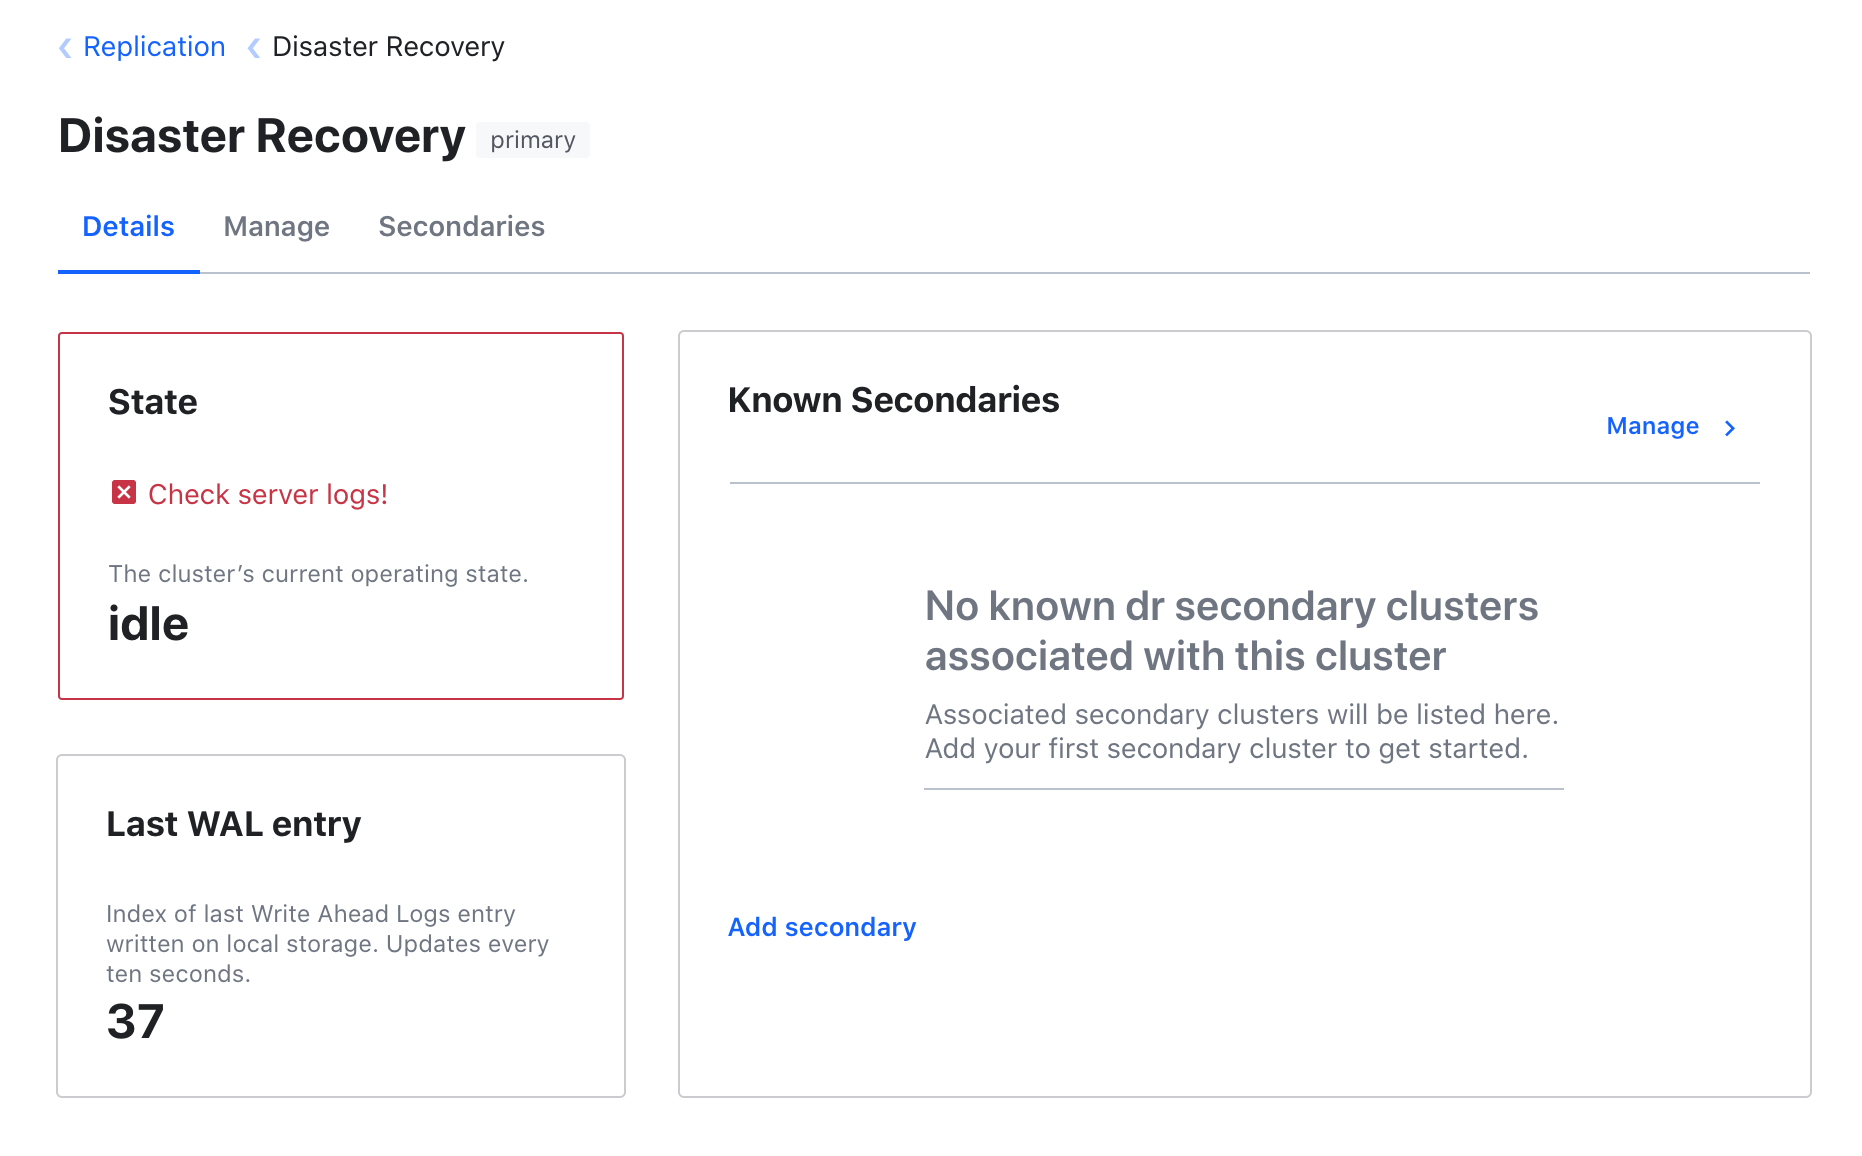
If there’s an error, we’ll surface it:
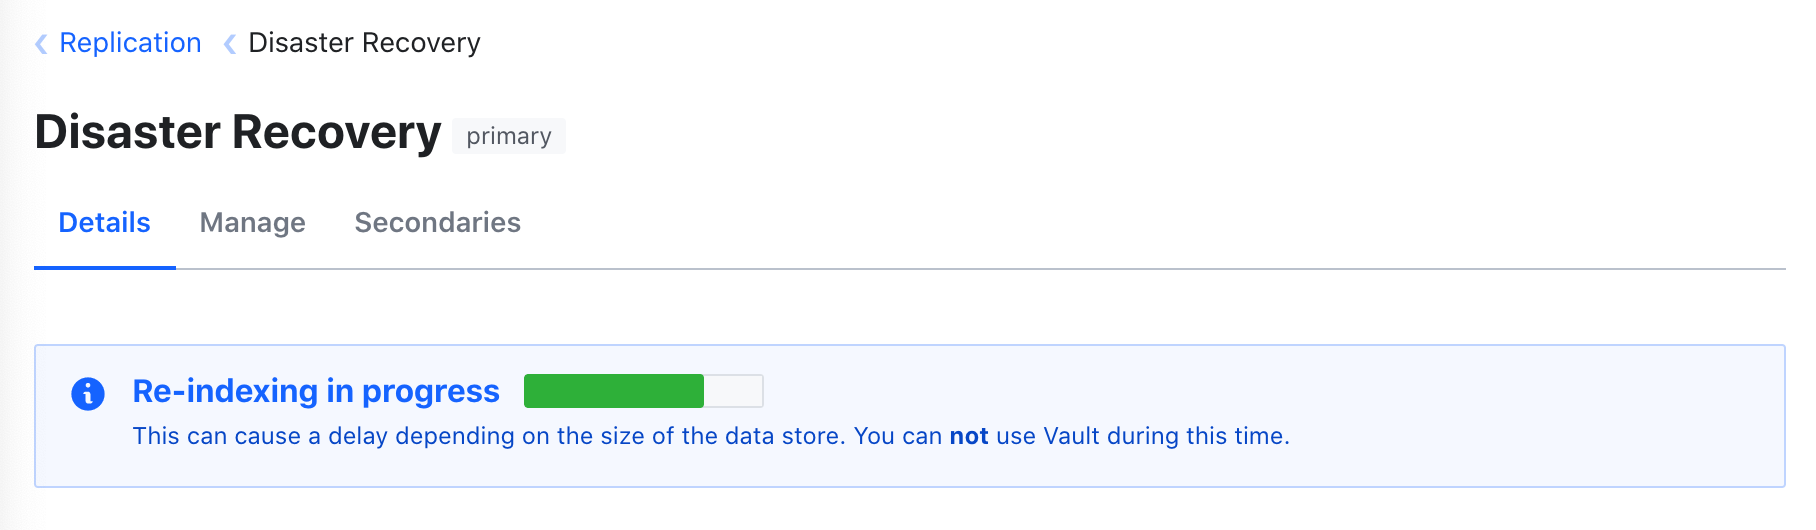
And when the cluster is re-indexing, we’ll show you the progress:
The real power is in comparing dashboards. To get a look at this, here’s a DR secondary:
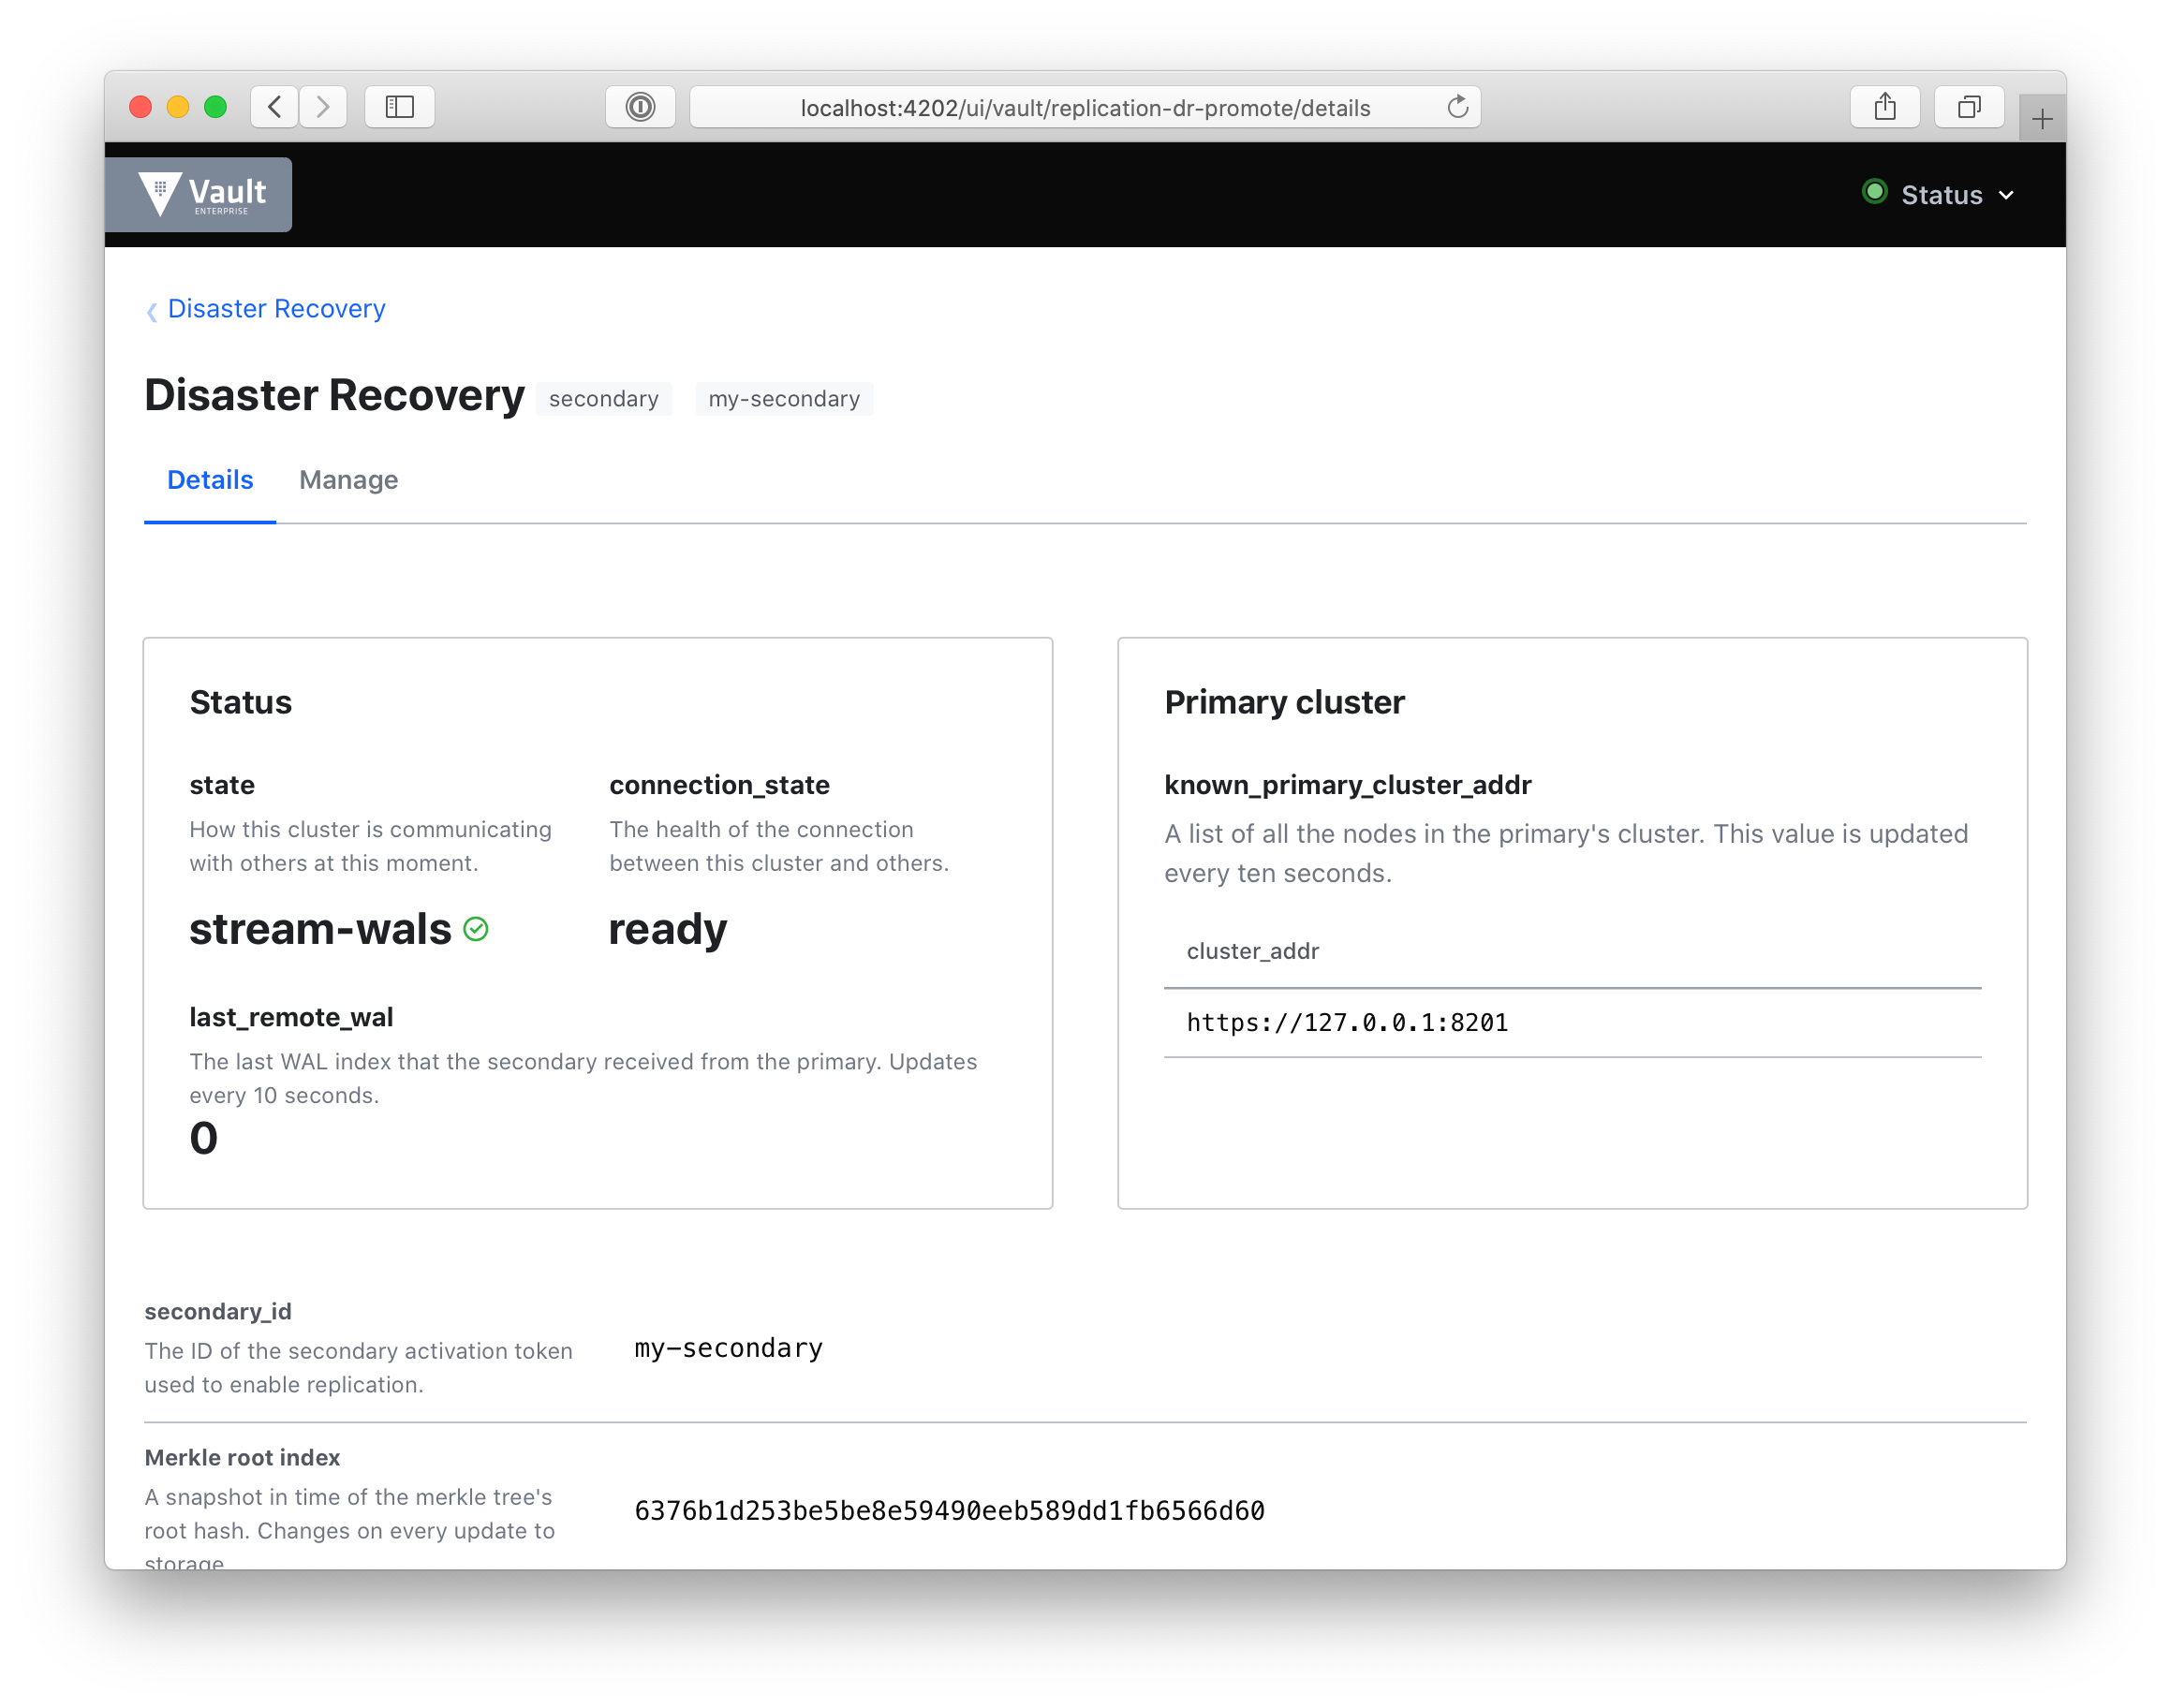
This dashboard is entirely new and includes:
- state: to quickly gauge how your secondary cluster is replicating data with its primary. If the cluster is in merkle-sync, we’ll show you the progress of that sync.
- connection_state: we’ll show you the health of the cluster’s connection. If this is idle, we’ll show you that, so you can troubleshoot quickly.
- last_remote_wal: the last write-ahead-log (WAL) entry received from the primary. This can be checked against last_wal in the primary dashboard above. This will update every ten seconds.
- known_primary_cluster_addrs: the list of addresses of all the nodes in the primary’s cluster. This list should always be non-zero. This is the heartbeat of your cluster.
Looking at the UI for both the primary and secondary allows for valuable comparison between the data presented so as to gauge the health of the cluster.
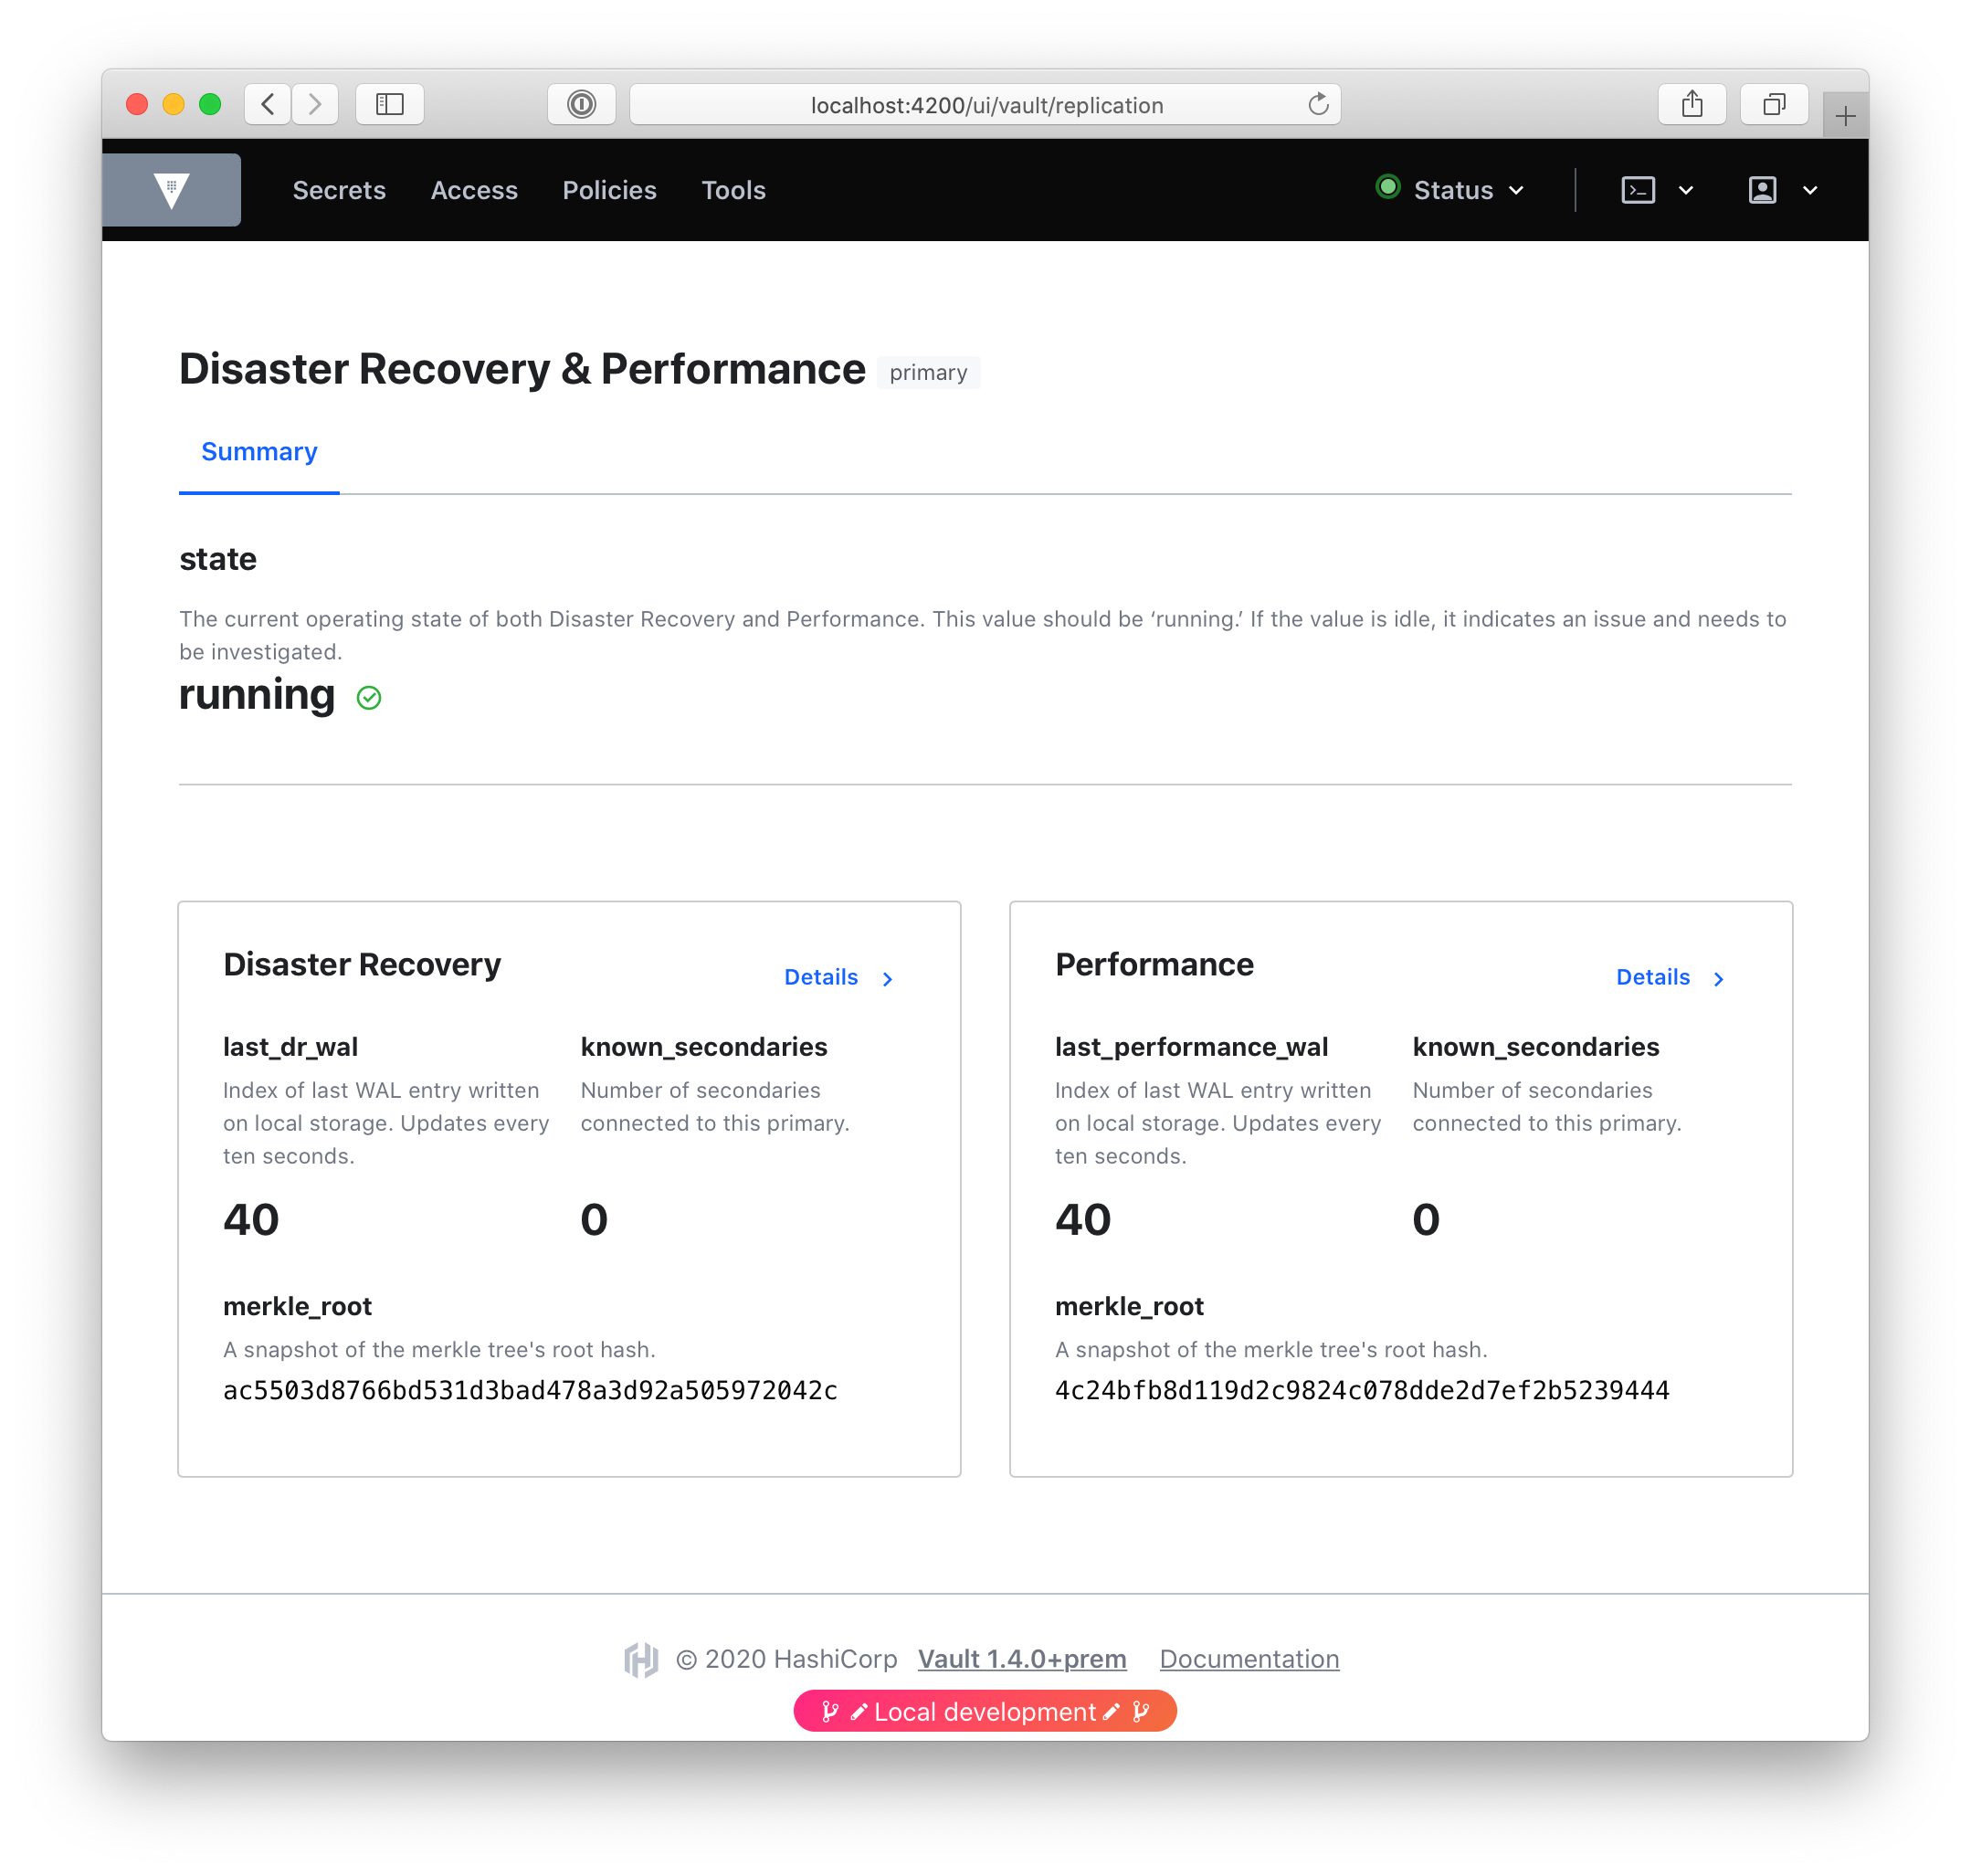
For the special case where the cluster is both a DR and a Performance primary, we created a custom “summary” dashboard that gives an overview of both, and links to individual dashboards for each:
There are also UI changes in the Manage tabs which include modals for each action to enable you to perform each action (promotion, demotion, generating tokens, etc.) with certainty. When performing a destructive action such as deletion or demotion, we’ve added a double-confirm.
»Process
Our process involved the collaboration of Product, Design, and Engineering in order to get it all done, with input from folks all across the company.
- We began with a PRD (product requirements document). This document outlined the background, the problem, and the requirements of the project. It also included personas and phases for the project. Customer feedback was used as its foundation.
- We then began some preliminary design work in order to begin understanding just how much data we had available to the UI, and how to present it. This is a fraction of the iteration, all of it including mistakes on what was available:
- RFC: After the PRD, a fundamental part of our process is the RFC (Request for Comments) document. Collaborating with the front-end team— — we understood what was available to the UI, what we’d need to ask for from the back-end team, and what just wasn’t available at all. The RFC presented our proposal to the whole company, invited feedback, and prompted change.
- Revision: Upon receiving feedback on the RFC from both leadership, support, and engineering as a whole, we made changes to the proposed designs (even adding the completely new Summary dashboard after feedback from Armon), and then began work!
- Front-end: The front-end team broke the project up into tickets, and continued to collaborate with design when adjustments needed to be made as constraints surfaced, or we gained new information. For example, when we demonstrated the UI to support folks, we learned just how important it was to show known_primary_cluster_addrs, and incorporated them into the new design.
- Documentation: In order to communicate these changes, updates were made to several Vault Learn guides.
»Next steps
Our next steps are to gather feedback on this iteration of replication. We’ve made a lot of changes here to the UI and the UX of this feature. We look forward to hearing what you think and continuing to iterate on replication.
To learn more about Monitoring Vault Replication, visit our learn guide on the topic.
Thanks for reading! And if this kind of work interests you, we’re also hiring!