
This is a guest blog written by SPH Media's Subramanian Swaminathan. SPH Media is a leading media organization in Singapore. Subramanian is a cloud platform engineer.
The data provided by HCP Terraform's Explorer API is a powerful way to gain deeper operational insights about your platform and infrastructure. When SPH Media first started managing our infrastructure as code, we needed a centralized view in order to gain a clear understanding of the state and configuration of Terraform and the resources we provisioned. By connecting Explorer data from HCP Terraform to our AWS data lake, we were able to remix the data into any visual format we needed. With this data, we created a custom unified dashboard to solve these long-standing problems.
In this blog, I’m going to share several example dashboard visualizations of the data we measure from HCP Terraform. I’ll also share our overall challenges and results related to this initiative so that decision makers can determine if building dashboards like ours would benefit their organizations as well.
Update October 29, 2025: HashiCorp's goal is to eventually make dashboards like these a trivial task to build. Learn more about the new Project infragraph.
»Challenge: We needed a unified view
When SPH Media first adopted Terraform, we needed a centralized view in order to gain a clear understanding of the state, configuration, and resources we provisioned. We encountered several issues:
Operational blind spots: Our team was unable to monitor the adoption and usage of HCP Terraform's advanced features. This made it hard to know how the platform's capabilities were being used.
Security vulnerabilities: It was difficult for us to consistently monitor the types of resources being created via HCP Terraform. This hindered our ability to proactively update internal security standards, implement necessary guardrails, and respond effectively to evolving usage patterns.
Inefficient platform support: The lack of insight into teams' resource creation patterns made it challenging to prioritize the development of best practices, recommended architectures, and reusable Terraform modules, slowing down our ability to provide effective platform support to development teams.
Compliance risks: Tracking the usage of deprecated resources, provider versions, or module versions was a manual process. Although module revocation is an option here, we still wanted to see the usage levels of all provider and module versions to see non-compliance risks on the horizon.
Cost inefficiency: Identifying opportunities to reduce unnecessary cloud expenditure was difficult. For example, we struggled to detect stale workspaces, which often indicate orphaned AWS resources that consume costs without providing value. Ephemeral workspaces help here, but we wanted more visiblity.
»Objective: Develop a unified dashboard
To address these challenges and more visibility into our HCP Terraform environment, we developed a unified dashboard. This solution centralizes and analyzes HCP Terraform data, providing the comprehensive insights needed to overcome these challenges and empower our team to work smarter.
SPH Media, being an HCP Terraform Plus user, is leveraging HCP Terraform’s features like change requests, team notifications, deprecate module versions, and ephemeral workspaces. The unified dashboard complements these features by providing the necessary visibility to find and implement changes effectively. For example, once the dashboard identifies workspaces that need updates:
SPH Media can create a new view in HCP Terraform's explorer, create change requests to those workspaces, and prompt respective teams who own it via team notifications to make those changes.
The deprecate module feature allows us to show warnings to teams about the upcoming deprecation and ask the team to upgrade modules or use different modules if necessary.
Ephemeral workspaces are used to destroy resources automatically if there is no activity after a period of time. SPH Media is also exploring ways to manage this at an HCP Terraform project level for test and sandbox environments.
We wanted to achieve five goals with this project:
Enhance usage tracking: Monitor the adoption and usage of advanced features in HCP Terraform.
Enhance security: Monitor the types of resources created via HCP Terraform and their usage patterns to determine where we should direct our security updates and guardrails (Sentinel policies/OPA in HCP Terraform or Service Control Policies in AWS).
Improve platform support: Monitor the types of resources created via HCP Terraform to inform our best practices, recommended architecture blueprints, and recommended Terraform modules.
Keep things up to date: Monitor usage of deprecated resources, provider versions, or module versions to ensure that older, less-secure, less-stable resources are not in use.
Optimize AWS costs: Identify larger-than-necessary resource provisioning to reduce unnecessary AWS expenditure and derive best practices for sizing. Identify stale workspaces to find out if AWS resources are no longer needed.
»Results: Cost, security, and efficiency benefits
The unified dashboard helped us achieve our five goals, giving us several significant benefits. We’ve linked this list of benefits to the relevant views in our dashboard — so this section can act as a partial Table of Contents for this blog. This section will cover the Project architecture, Technology stack, and How it works.
With the introduction of our unified dashboard, the platform team is now able to:
Monitor resources that consumer teams are provisioning. This allows the team to continually update security policies that ensure baseline guardrails are in place, even for new resources created.
Proactively identify workspaces using deprecated resources as well as outdated provider and module versions, ensuring compliance with organizational policies.
Continually identify and clean up stale workspaces to optimize cloud resource usage.
»Project architecture
The dashboard architecture follows a modular design leveraging AWS services for scalability and automation. The key components are:
Data sources: HCP Terraform
Data extraction: Automated using GitHub Actions
Data storage: S3 bucket
Data processing: Lake Formation and Glue services
Data querying: Athena for SQL-based querying
Data visualization: QuickSight dashboards for insights
The following diagram illustrates the architecture:

»Technology stack
Here’s a deeper look at the technology components:
»GitHub Action
Automates the process of fetching data from HCP Terraform using a Python script
Scheduled to run at predefined intervals to ensure up-to-date data
»S3 bucket
Acts as the central storage for raw data extracted from the data sources
Organizes data into folders by source and type for easy processing
»AWS Glue crawler and tables
Scans the data stored in S3 and automatically generates metadata
Creates and updates tables in the Glue Data Catalog
»AWS Lake Formation
Manages data access permissions and ensures secure sharing of the data catalog
»AWS Athena
Provides an interface to query the data in the Glue Data Catalog
Enables ad hoc analysis of the collected data
»AWS QuickSight dashboards
Visualizes the processed data to provide actionable insights
Includes metrics such as:
GitHub Advanced Security feature adoption
Coverage of repositories by CodeQL
HCP Terraform workspace resource tracking
HCP Vault namespace and entity summaries
»How it works
The implementation requires
Configured GitHub repositories and HCP Terraform workspaces for data extraction
An AWS account with S3, Lake Formation, Glue, Athena, and QuickSight
Proper IAM role and permission setup for AWS services
GitHub Actions configured for automated data extraction
»Solution
The solution involves implementing an automated pipeline that collects data from HCP Terraform. This data is processed and stored in AWS, where it is analyzed and visualized in QuickSight dashboards.
»Key Steps
Data collection:
Use GitHub Actions to fetch data from HCP Terraform.
Store the extracted data in an S3 bucket in a structured format.
Data processing and cataloging:
Use AWS Glue Crawlers to catalog the data stored in the S3 bucket.
Register the data in the AWS Glue Data Catalog to make it queryable.
Data analysis:
Query the cataloged data using Amazon Athena.
Data visualization:
Use AWS QuickSight to create dashboards that provide insights into usage, cost optimization, and security metrics.
»Example dashboards
Here is how our unified dashboard charts turned out. We have divided individual views into three categories: Visibility, security, and compliance.
»Visibility
The visibility views provide insights into what kind of infrastructure components teams are provisioning, and how much they’re provisioning.
»Resources under management (RUM) usage across the org
We can see how resource usage is growing or shrinking over time in this chart.

RUM costs can also be added to this chart.
»Popular modules
We can view all public and private Terraform modules used across the organization, and compare levels of usage. This helps us respond to evolving usage patterns and ensure that we know which modules to closely scrutinize when we build security guardrails within modules or with policies.

Our two most popular modules are the AWS API gateway and Lambda GitHub Actions modules.
We can also view just public or private (internal) modules.

»Popular providers
We can see which organization/namespace's providers are most frequently used across the organization. This shows us which providers to monitor more closely to keep a secure software supply chain.

To track which providers in a particular namespace are popular, we can go to our most used providers charts. This one shows the popularity of official HashiCorp providers currently in use.

To provide an overall view of the most popular providers from all sources, we have a table view chart. It also sorts usage by our three HCP Terraform organizations: sph-aft-stg, sph-aft, and sph. The sph-aft and sph-aft-stg organizations manage workspaces related to our AWS accounts through AWS Control Tower Account Factory for Terraform, while the sph organization is for managing application-level workspaces.

We can see the breakdown of resource usage across the three organizations grouped by resource type. The primary purpose of this table is to find the most frequently used Terraform resource types and how they are distributed across three organizations.

In the table below, we show the number of Terraform resources in each workspace, which helps to identify the workspaces contributing most to overall resource consumption. This insight allows us to target high-usage workspaces for potential optimization efforts, such as resource consolidation.

Below, we can see the number of Terraform resources created grouped by the module name. This helps us figure out which module is contributing most to the resource usage across the organization.

We can even drill down further and see which resource types in those modules are contributing most to the resource usage. In this view, you can see that aws_ssm_parameter is the most provisioned resource type.

This donut chart visualizes the number of billable resources across various environments. This chart helps us understand where Terraform resources are concentrated across environments, which allows us to make informed decisions on cost control, scaling strategies, and optimization opportunities.

This second donut chart visualizes the number of resources by various teams, which can help us track resource ownership and serve as a metric to drive Terraform adoption across the organization.

This donut chart visualizes resources grouped by component tags, helping us identify key consumers of our infrastructure. By cross-referencing this data with the cloud monthly bill, we can pinpoint components that are candidates for Terraform onboarding, particularly those not yet managed via IaC.

»Security and stability
For more direct security insights, we also track Terraform state versions and configuration drift.
»Terraform state versions
Track Terraform versions used across different workspaces. By combining information from this chart with HCP Terraform's change request feature, we can make sure all our workspaces use the latest major version of Terraform.

»Drifted vs. undrifted resources
We can view the number of resources that have drifted from their source configuration vs ones that have not. This first chart shows drifted vs. undrifted resources across all three of our HCP Terraform organizations.
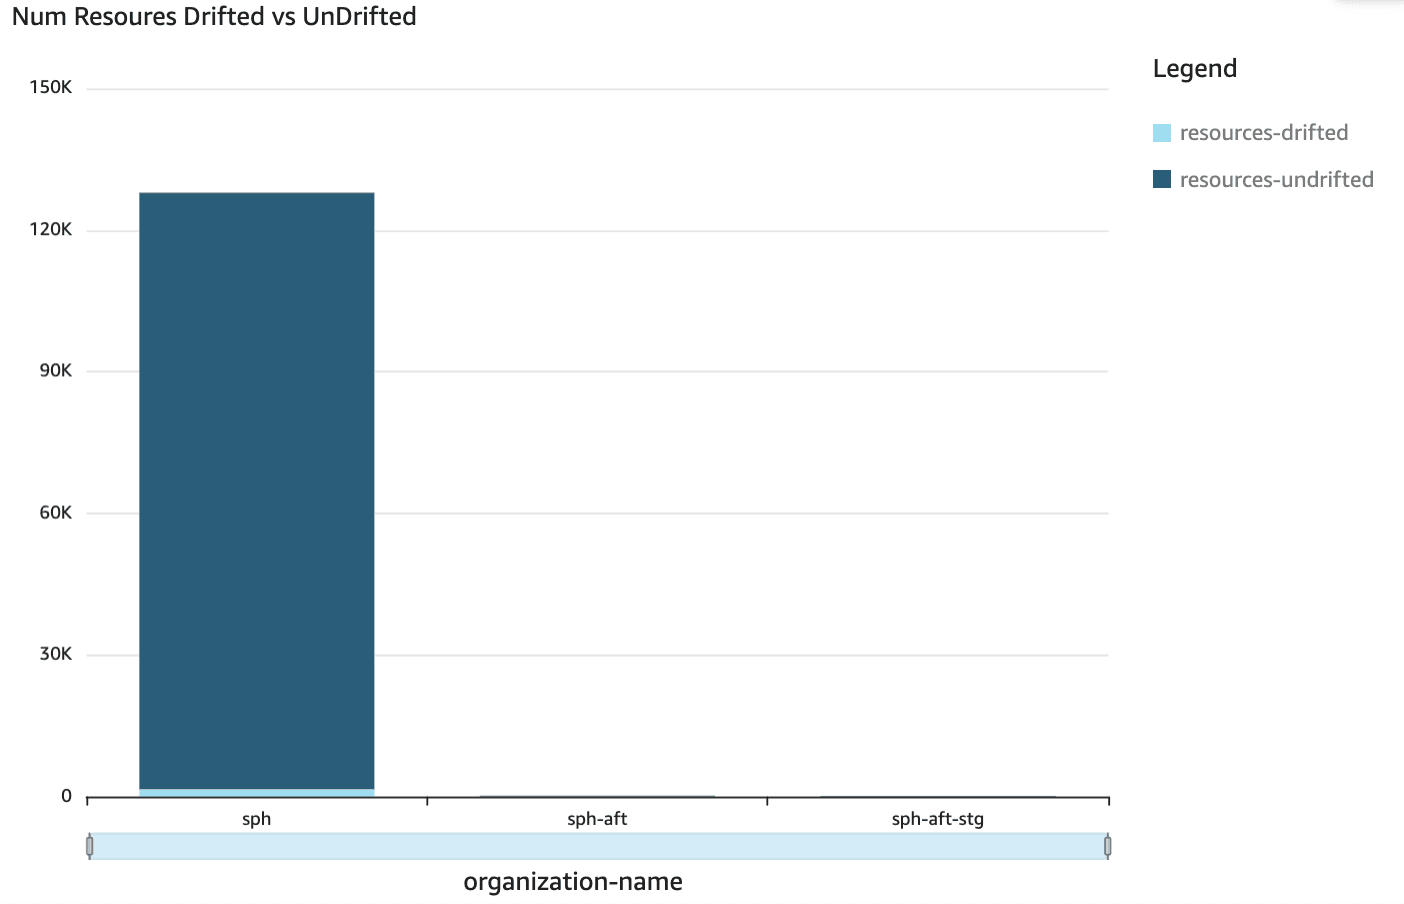
We can also look at the number of drifted vs. undrifted resources in specific workspaces. This helps us find out if one particular workspace is creating the majority of resource drift.

We can even zoom into the project level to see if any projects are generating more drift than the others.

This bar chart informs us if any workspace is using the deprecated version of a Terraform module so we can take any necessary action to upgrade to the latest version.

»Compliance
Finally, our compliance charts show if any outdated provider or module versions are being used, ensuring compliance with organizational policies.
»Provider versions
This chart lets us see the usage of each provider's different versions across different workspaces. This helps us ensure that there are no deprecated versions of any providers being used in any workspace.

We can also drill down into each provider to see how specific provider versions are used across different workspaces. The example chart below shows all the AWS provider versions used, along with the amount of usage.

Here is a chart showing AWSCC provider usage.

»Module versions
We have charts that can drill down into module usage by version as well. This helps us confirm whether our guardrails are sufficient, ensuring that no deprecated versions are still in use.

»Workspace Terraform versions
We can view the Terraform versions used in each workspace so that we know when to take action and upgrade older versions being used in certain workspaces.

»Terraform checks
Terraform checks are a powerful continuous validation and compliance feature in HCP Terraform. This chart shows us exactly how many checks have passed, failed, thrown errors, or encountered other situations. This keeps us informed about compliance rates and makes audits a lighter lift.

»Key takeaways
Visibility makes large-scale decisions and audits easier. The largest areas of impact from our unified dashboard include:
Helping us find deprecated and outdated resources
Giving us a way to monitor security policies
Pointing us to stale workspaces for clean-up
These and other benefits from the dashboard have a real impact on our business. It provides comprehensive visibility into infrastructure management and we think that a lot of other organizations would benefit from building a dashboard for their needs as well.
A Terraform visibility dashboard can significantly improve operational efficiency, security, compliance, and cost-effectiveness. By centralizing and analyzing data, SPH Media now proactively addresses critical issues, optimizes resource utilization, and makes informed decisions about everything we do in HCP Terraform.
About the author: Subramanian Swaminathan is a cloud platform engineer with over 15 years of experience in building scalable, secure, and automated infrastructure. He specializes in AWS, HashiCorp Terraform, HashiCorp Vault, DevOps practices, and application security, and is part of the cloud platform team at SPH Media in Singapore. Driven by a passion for developer experience and operational excellence, Subramanian often builds practical solutions to address the real-world challenges he encounters at work.