

“In time, those Unconscionable Maps no longer satisfied, and the Cartographers Guilds struck a Map of the Empire whose size was that of the Empire, and which coincided point for point with it. The following Generations, who were not so fond of the Study of Cartography as their Forebears had been, saw that that vast Map was Useless”
—Jorge Luis Borges, Del rigor en la ciencia (translated)
The downside to automation is that suddenly everything is happening all at once and we no longer know what’s going on. We solve this new problem with monitoring and observability tools. The downside to monitoring and observability is determining what’s worth paying attention to.
HashiCorp Nomad 1.0 has a first-party zero-configuration topology visualization tool to help operators stay on top of their clusters.
»Monitoring Stacks
Nomad has always been guided by two principles: simplicity and flexibility. Nomad should be simple to operate and flexible enough to support a wide variety of workloads. This shows up in a lot of places. Nomad integrates seamlessly with HashiCorp Vault and Consul, making service discovery and identity-based security simple. Nomad has always supported multiple task runtimes and devices–this now includes pluggable task drivers and device drivers.
A common refrain about Nomad is that it’s just a single binary. While this is technically true, it’s a bit misleading. To run Nomad in a production capacity, you will need a collection of supporting services. As mentioned, Vault and Consul are a couple of big ones. Your monitoring stack will also serve an important role. Nomad does not have any included monitoring tools, but it does integrate with a variety of third-party providers by forwarding telemetry data.
The first step on this journey is following the excellent Using Prometheus to Monitor Nomad Metrics tutorial. After following this tutorial, your cluster will now be running Prometheus and an HTTP proxy.
The next step is to make use of this data Prometheus is collecting. For this you will likely end up on the metrics reference documentation. At this point, the scope of the task will be sinking in, and we haven’t even talked about graphs and dashboards yet.
»The Owl in the Room
Saying that Nomad is operationally simple and then expecting all of this to set up a monitoring stack is a bit like the classic “how to draw an owl” joke. Starting with some circles is fine and ending with an owl is desirable, but surely there are some steps in between?

This conundrum was top of mind when deliberating our options and our product boundaries. We were also able to validate this gap with a community survey late last year.
The next step was coming up with a design that could fill this gap. Our design goals were
Optimize for density: We want to fit as much information on the screen as possible, and clusters can get really large.
Don’t duplicate existing features: The Nomad UI is already rich with features. We don’t want to create parallel workflows.
Start explorations: Most of the UI is oriented around diagnosing or fixing issues. This is an opportunity to do preventative maintenance.
And our constraints were:
Use the data Nomad already has: We didn’t want to complicate Nomad core for the benefit of this. This meant we were limited to point-in-time data.
Zero-configuration: Given that the point is to offer something out of the box, we couldn’t rely on toggles and settings to make the visualization better for an individual. We needed a single visualization system that worked for all clusters.
Start somewhere: A feature like this is so highly dependent on the underlying data that it needs external validation. We couldn’t spend months refining and iterating in isolation.
We got to work and, with help from the community, built the topology visualization.
»A Brief Tour of the Topology Visualization
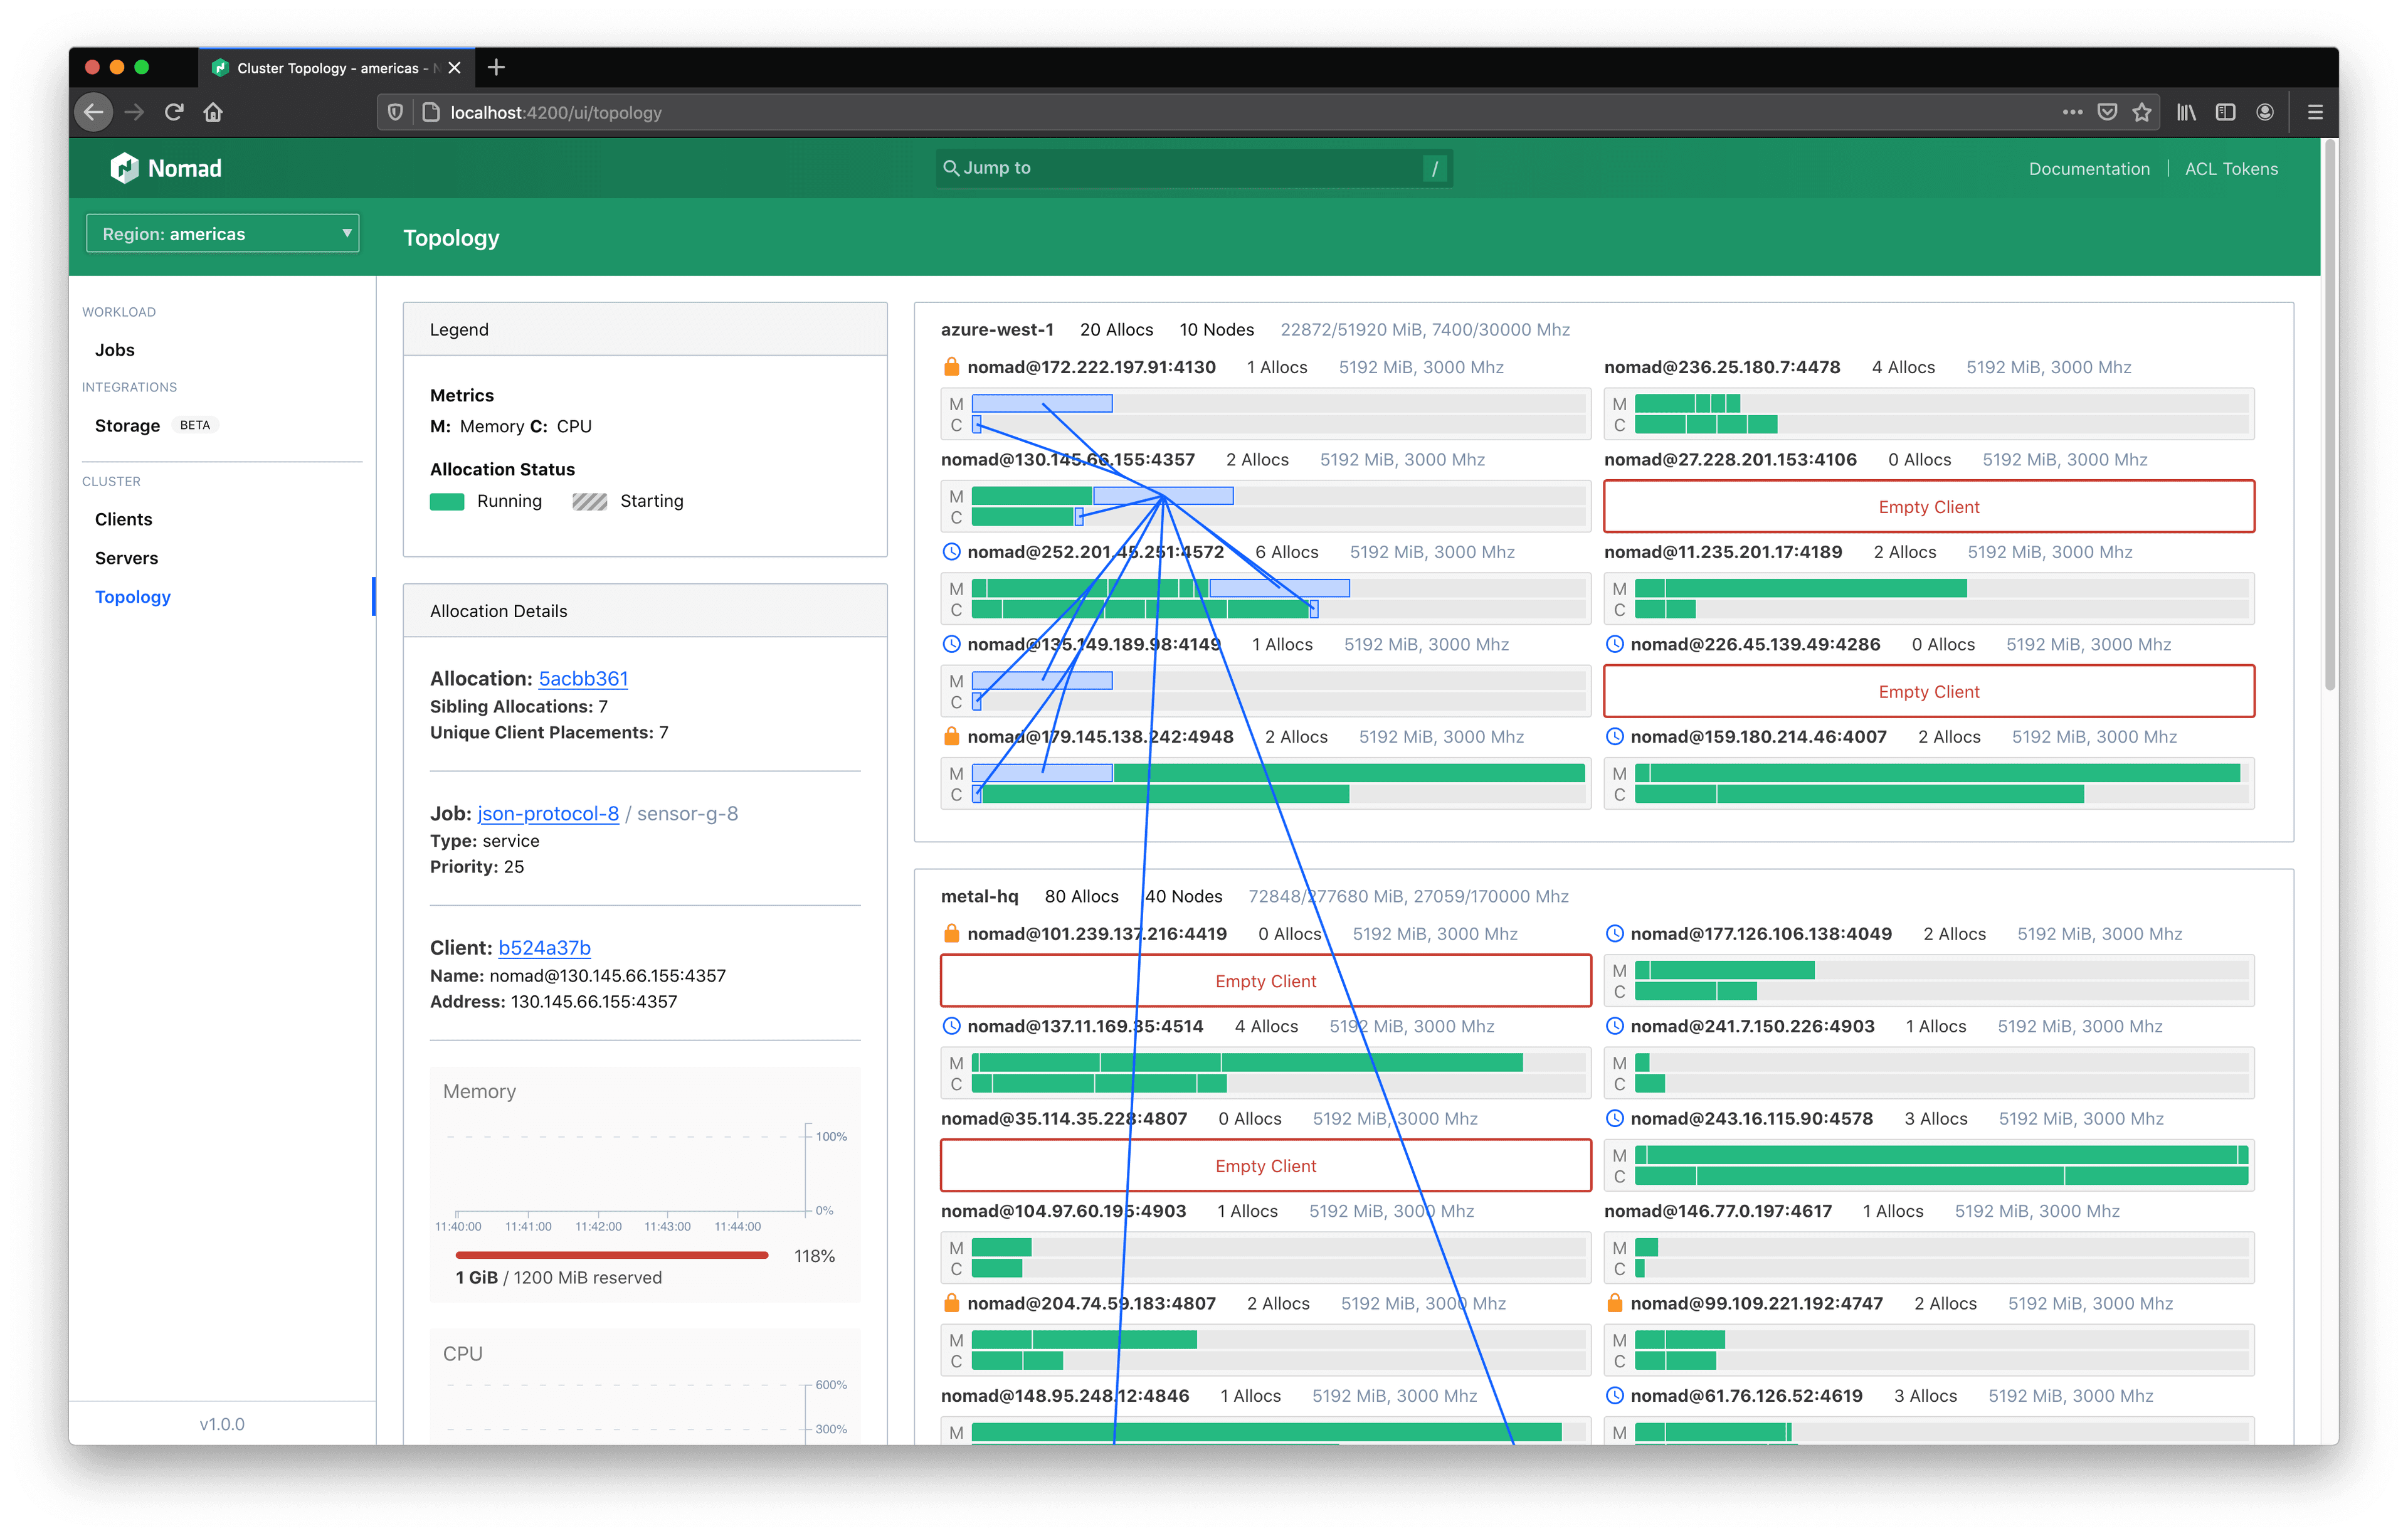
From the UI of a Nomad cluster running v1.0 or higher, the topology can be accessed from the left-hand navigation under “Cluster > Topology”.
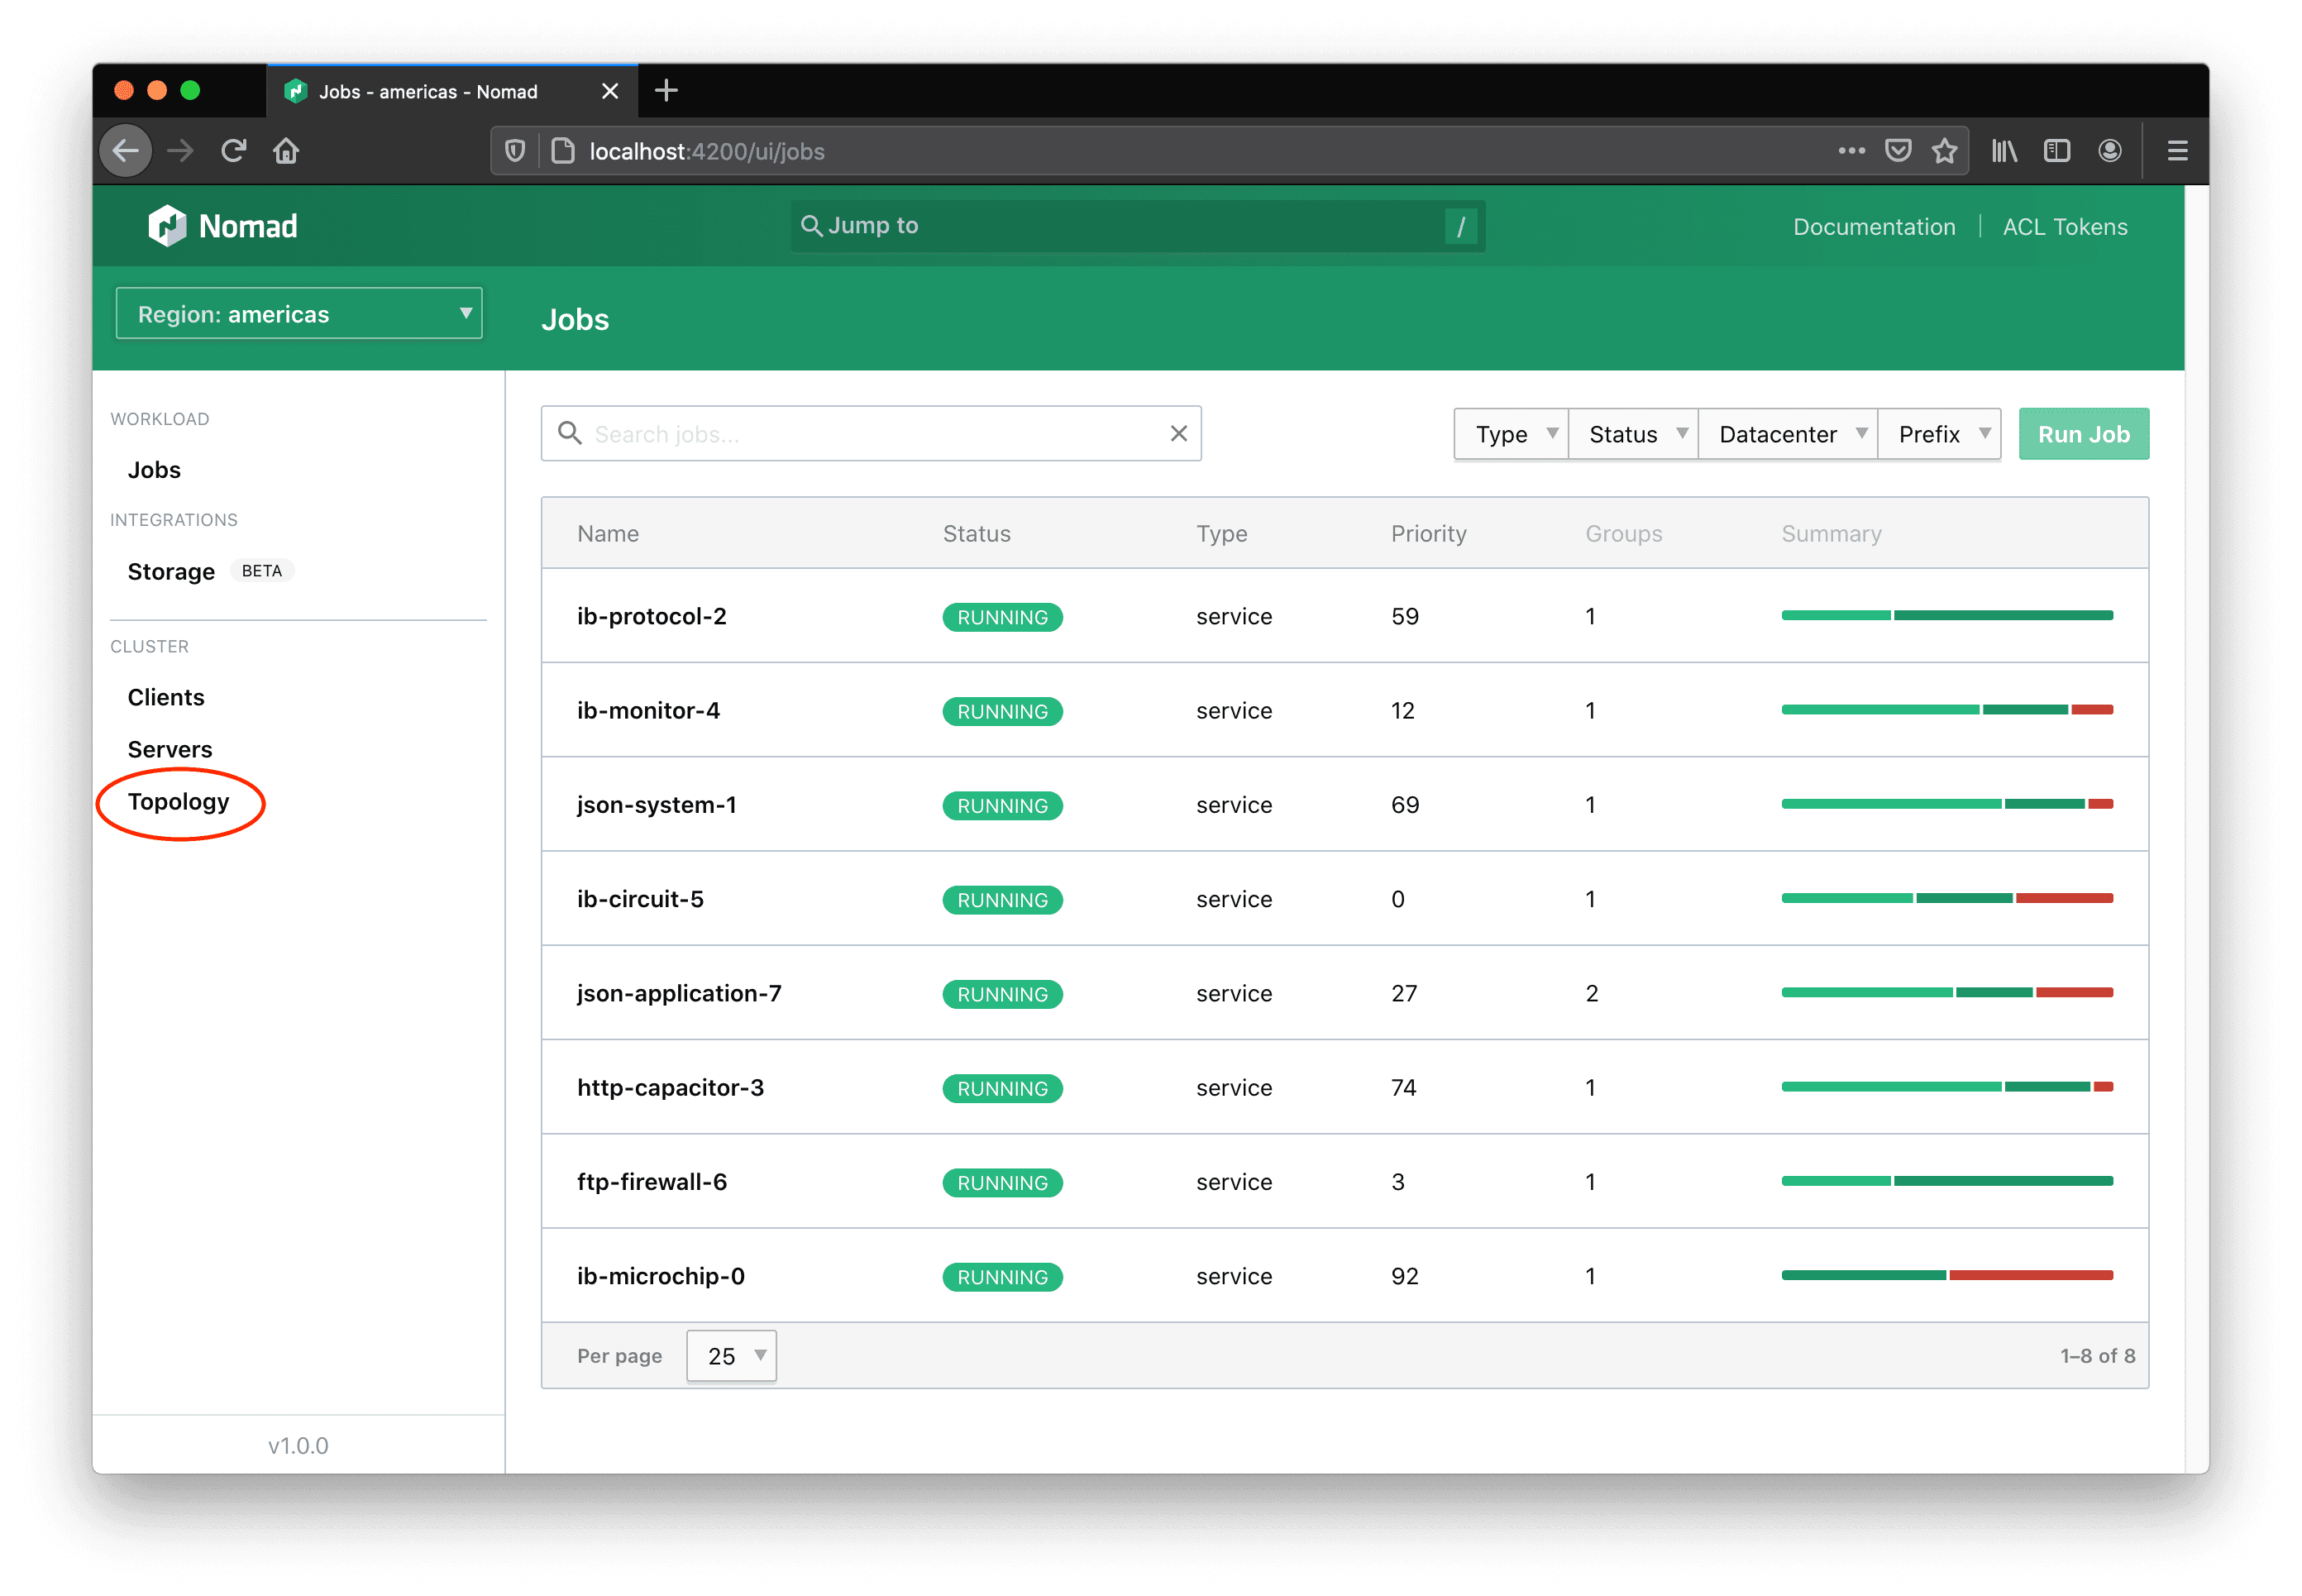
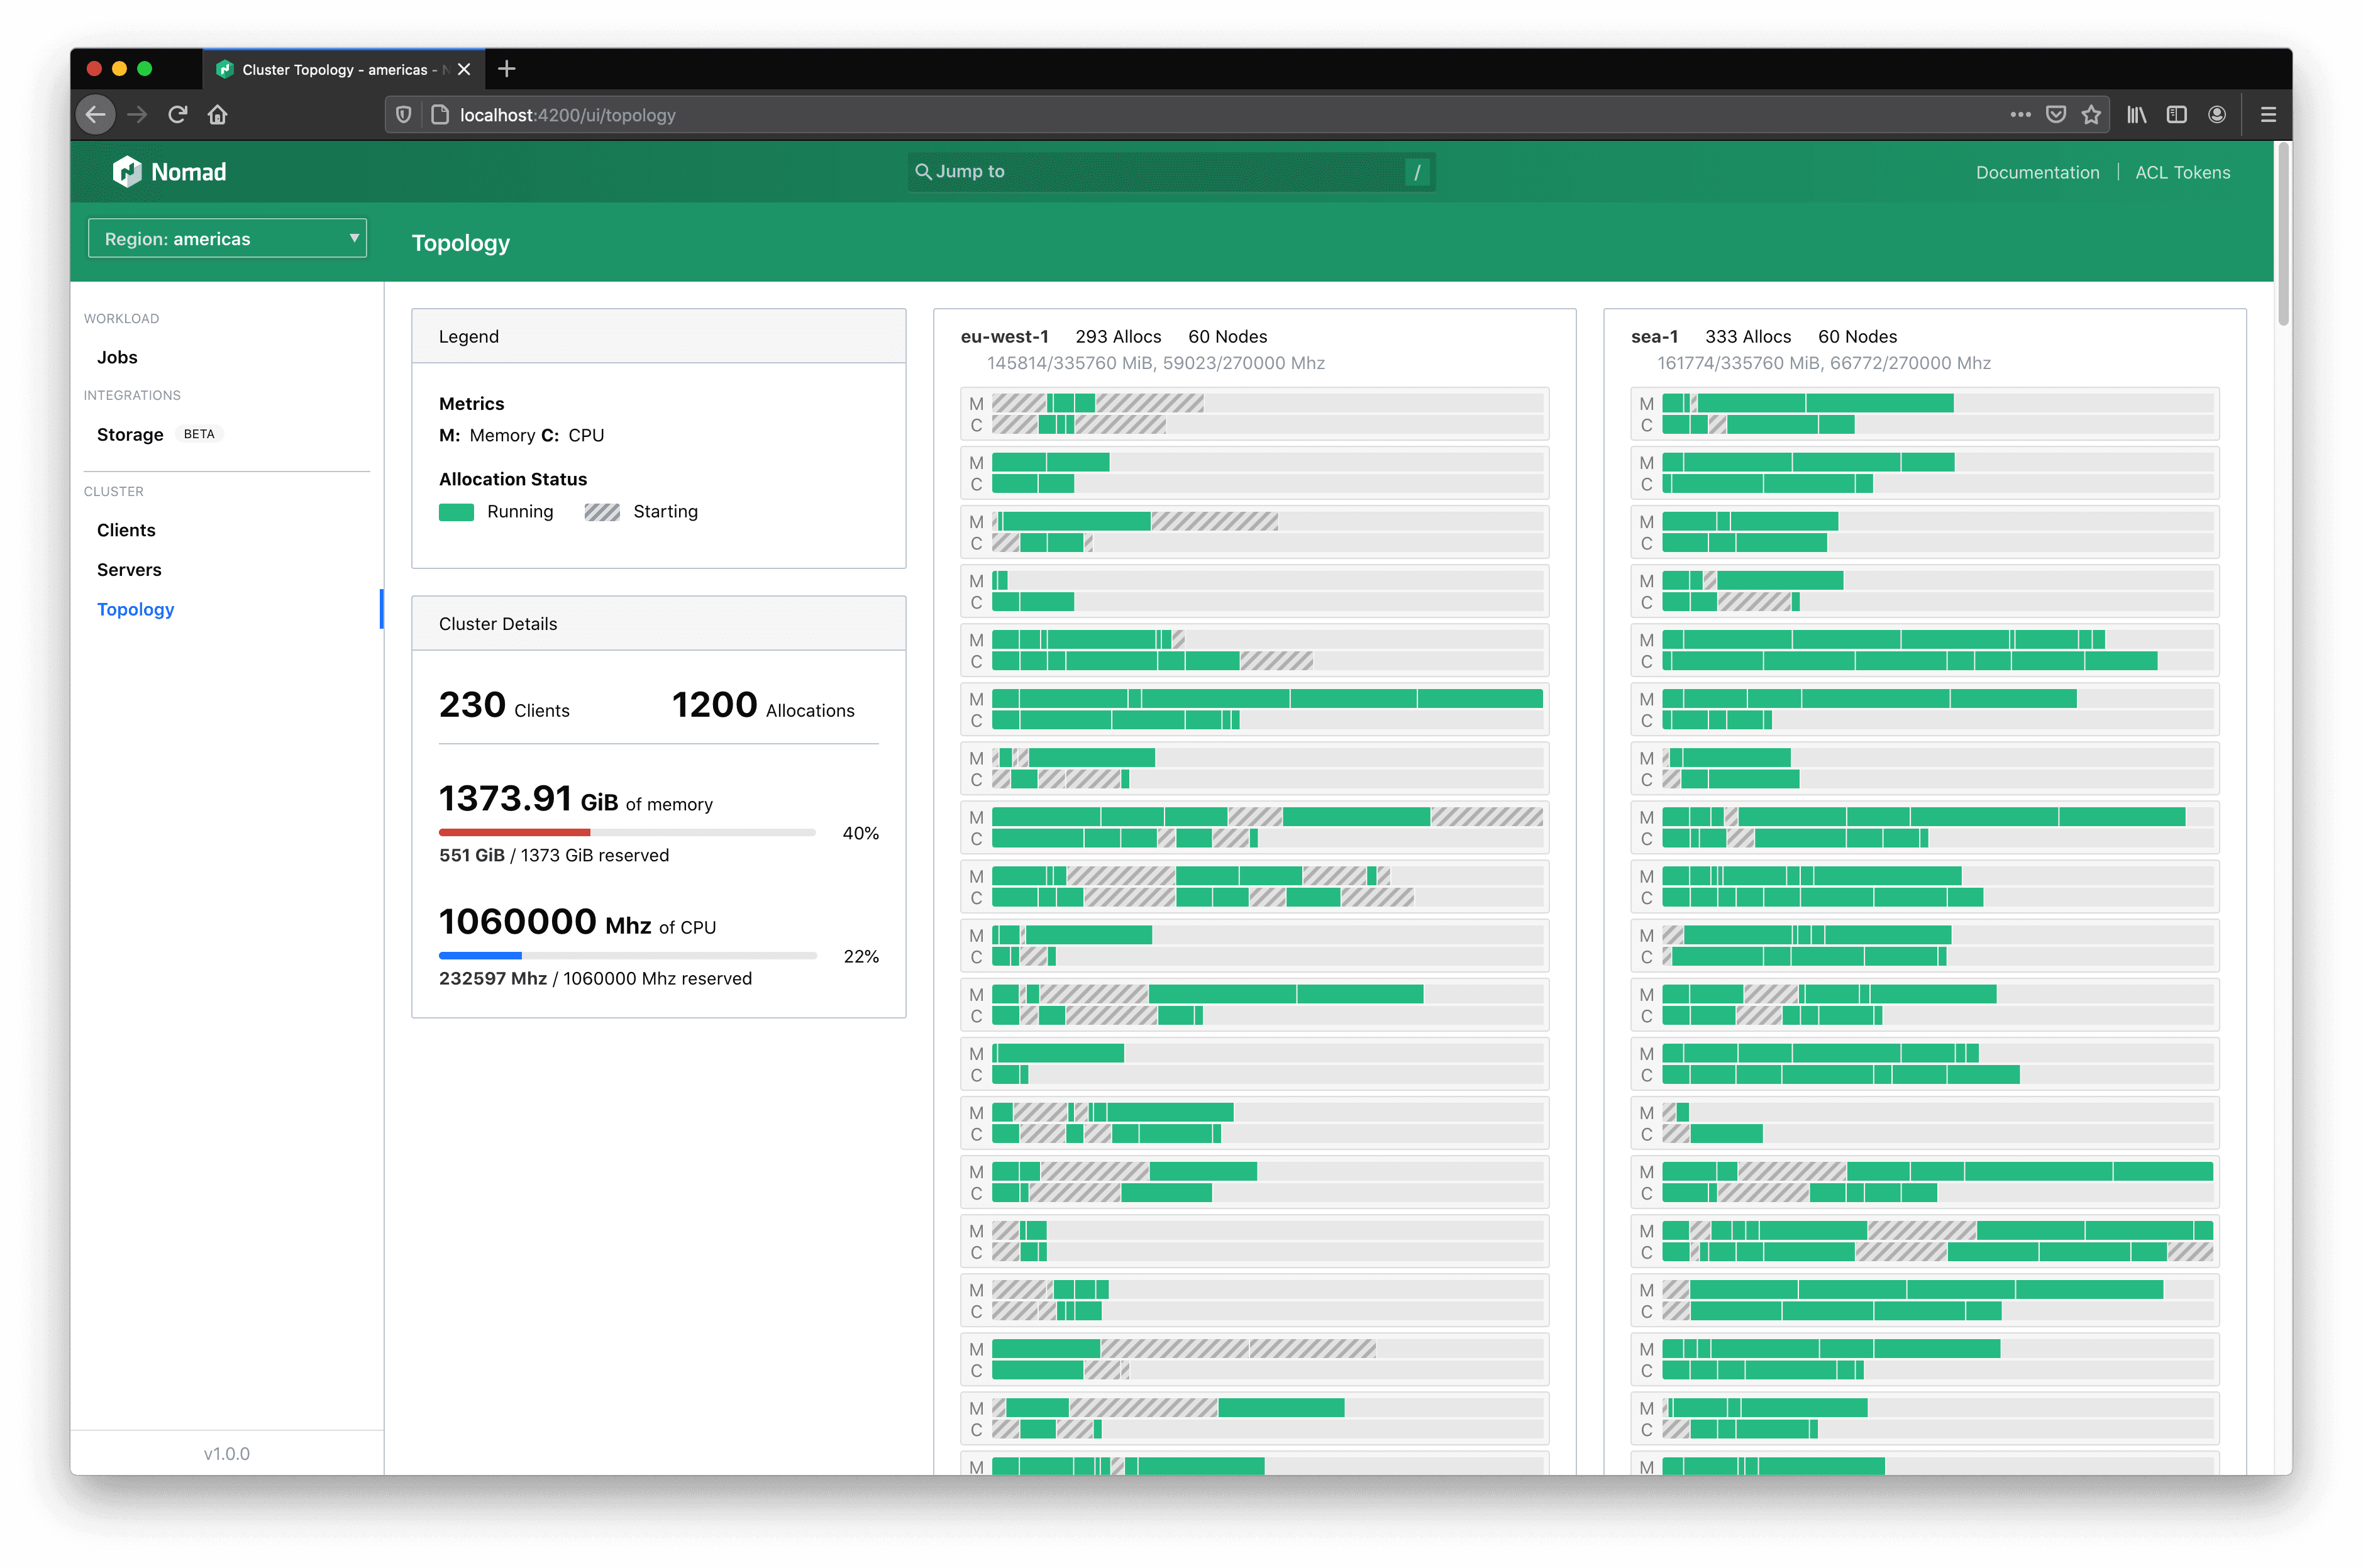
Here the entire cluster can be observed all at once.
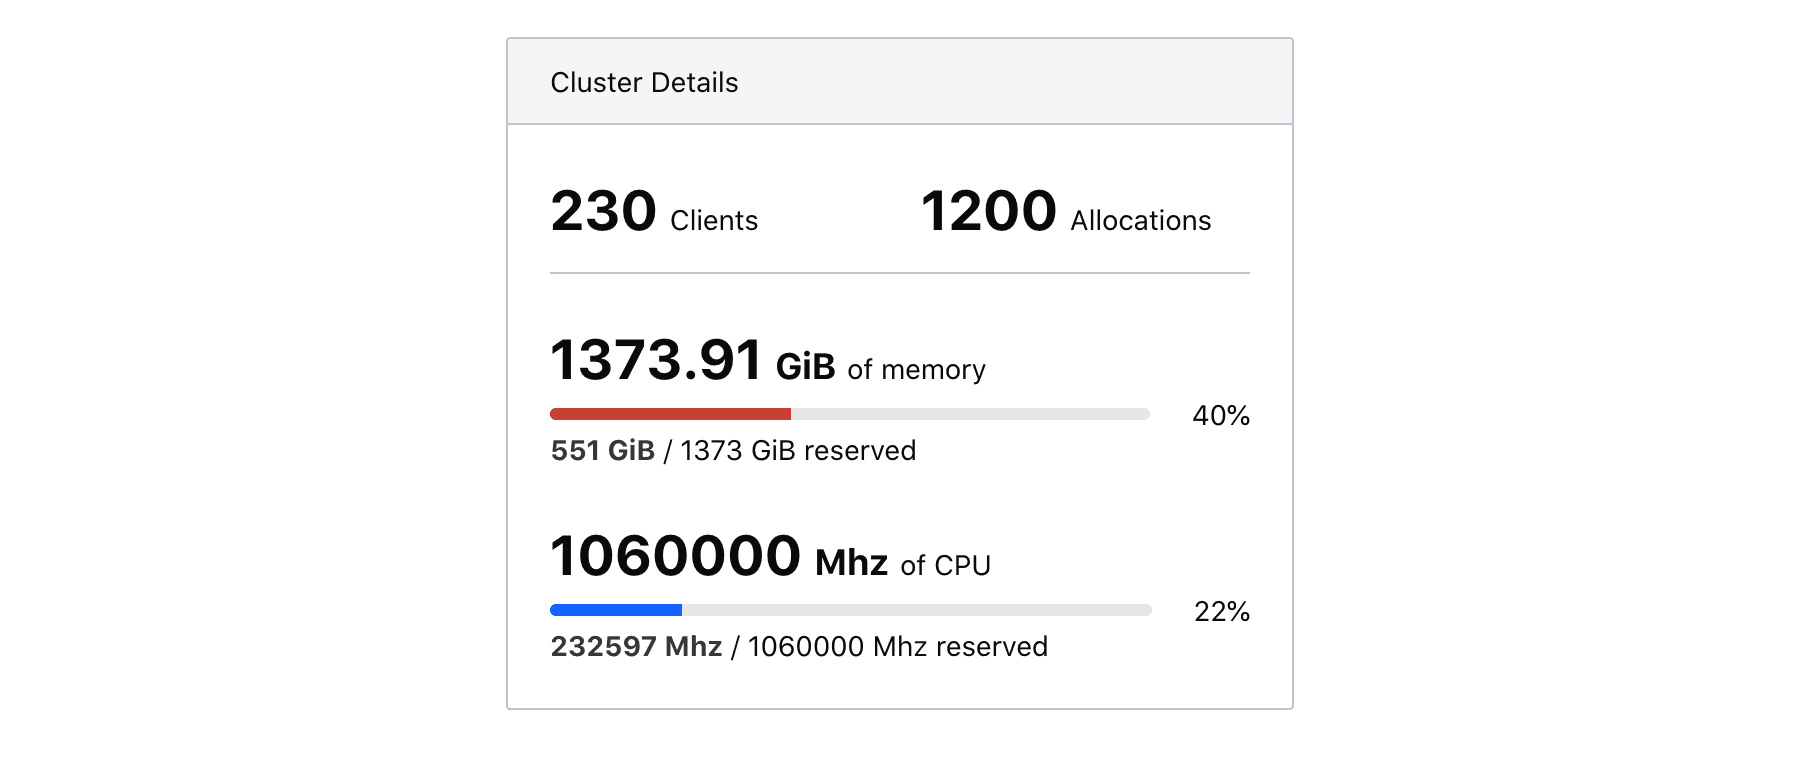
»Aggregate Cluster Information
The left-hand information panel contains information about the cluster including the total count of clients, the total count of allocations, and the reserved vs. total capacity of memory and CPU.
»All Your Allocations Organized
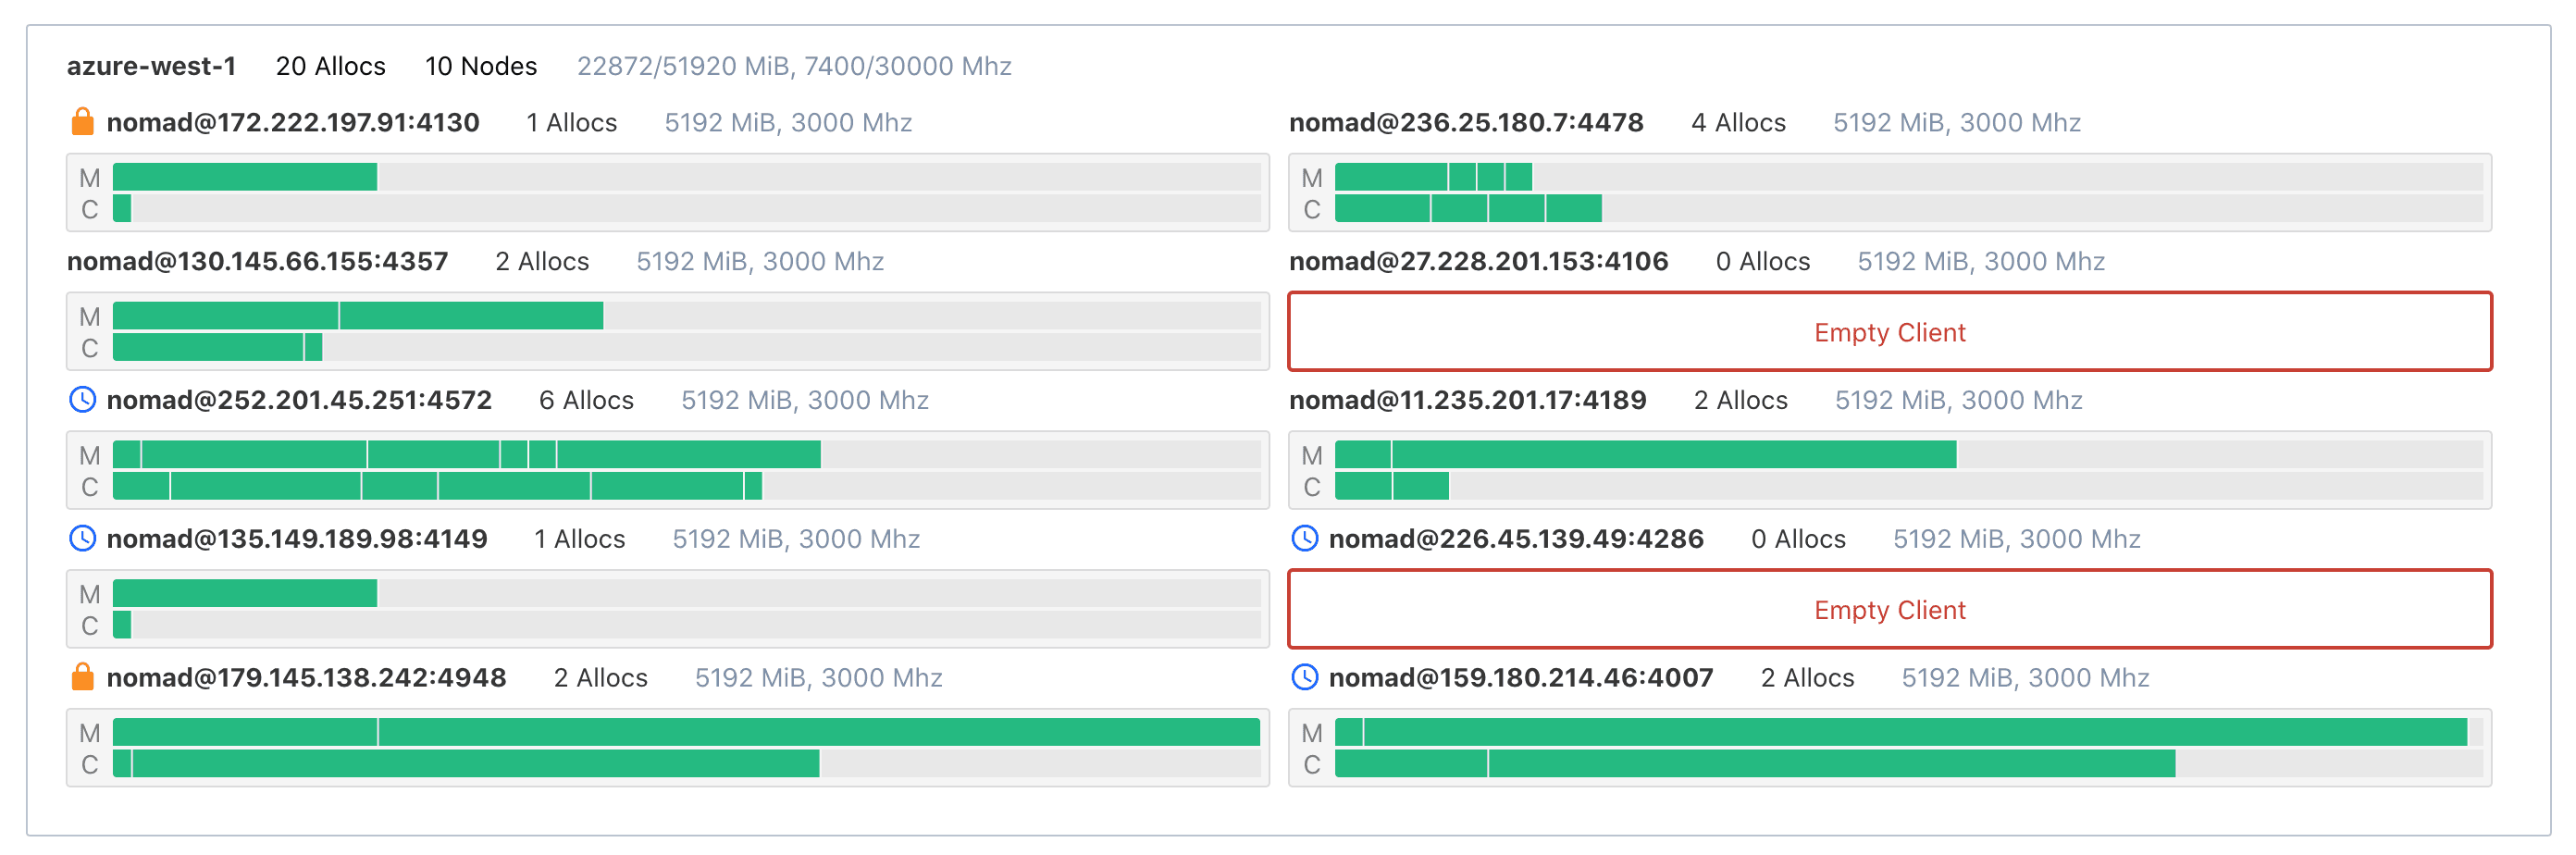
The main visualization organizes all allocations by client and datacenter. Each allocation is represented by two rectangles drawn proportional to the amount of capacity they have reserved on their client. Clients are, in turn, drawn according to their size, (i.e., your client nodes with less memory will be shorter than your client nodes with a lot of memory).
This organization matches the Nomad data model. Seeing everything laid out in this manner will help solidify your mental model of how Nomad operates and how your allocations coexist.
»See Allocation Distribution for the First Time
Most services running in a workload orchestrator will be horizontally scaled for fault tolerance and to meet user demand. A job file may use constraints to influence placement decisions, but the actual decisions are made by the Nomad scheduler.
Clicking on allocations in the topology visualization will associate all allocations for the same job and task group. This makes it immediately apparent if the placements went as expected or if the job file needs to be tuned further.
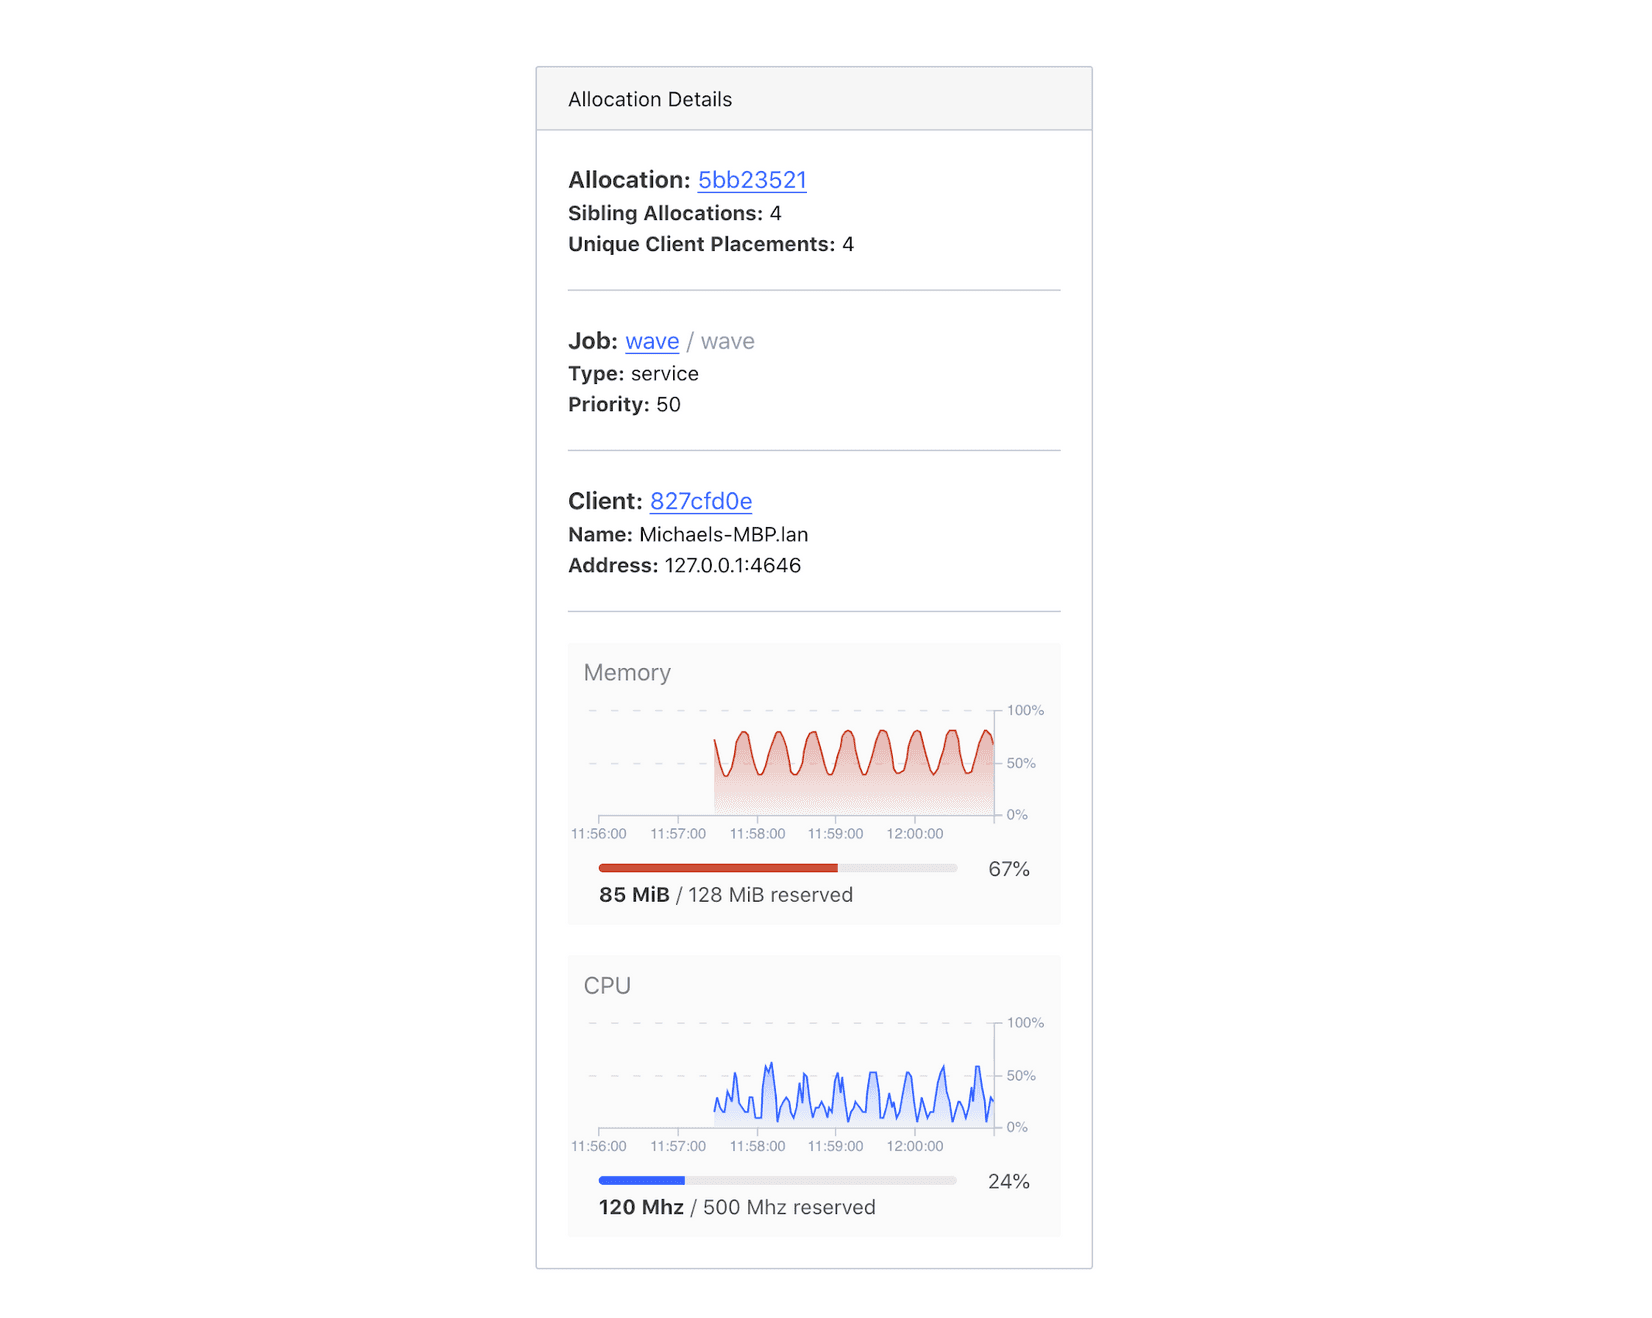
»This is Just the Starting Point
As mentioned in the design goals, we want to encourage exploration of the cluster state, and we didn’t want to duplicate features. When an allocation is clicked, the info panel will show more details about the allocation under examination.
From here, you may choose to continue your investigation by quickly going to the allocation details page (maybe to view logs), the job detail page (maybe to double check the job spec), or the client detail page (maybe to review driver health and client events).
»Graduating to Other Tools
The topology visualization is meant to scale for clusters of all shapes and sizes, but it is limited in its feature set. It doesn’t show real resource utilization, it doesn’t have historical data, and it doesn’t include a variety of other metrics that may be useful for your workload.
This is okay.
Remember Nomad’s principle of flexibility, and remember the owl problem: if the topology visualization only served your needs for the first 100 days of using Nomad, but it then helped you build out your own monitoring stack, then it did everything it needed to do.
We live in our DevOps tools. Just like how we rearrange furniture and buy decor for our physical spaces, it only makes sense we’ll eventually want to customize our virtual spaces to suit our needs too.
»Try Out Nomad 1.0 Today
Nomad 1.0 is currently in beta, and we couldn’t be more excited to share it with you all. If you are a seasoned Nomad user, let us know how you like the new features. If you have never used Nomad, now is the time to check it out.


