

This blog post will answer two challenging questions operators often face after deploying a HashiCorp Vault cluster:
How do we get logs from all the nodes?
Which events are important and how can we alert on them?
… all without impacting Vault service availability or depending on legacy IT systems.
The post outlines a free solution for Day 1 logging and alerting that runs on Amazon Web Services (AWS). The configuration files can be applied anywhere you run Unix/Linux systems on a small compute instance. Follow along by building this solution yourself using the HashiCorp Terraform provisioning code in this GitHub repo: vault-syslog-ng-audit.
Here's a preview of what we'll build:
Vault logging to local syslog-ng socket buffer. Forwards to remote syslog-ng.
»Background
The ability to audit secrets access and administrative actions are core elements of Vault's security model. HashiCorp follows the Unix philosophy of building simple modular tools that can be connected together. Rather than building security information and event management (SIEM) features into Vault, HashiCorp focuses engineering resources on core secrets management capabilities and generating a robust audit log that can be sent to purpose-built log management and alerting tools.
However, many companies still struggle with log management and alerting. Small companies may not already have a shared logging service. Using an existing logging service in a large company may be cumbersome or expensive. So this post presents an effective, no cost Day 1 solution to this problem using syslog-ng that might be a good fit for your organization.
»Log Types
Vault generates two types of logs:
JSON audit logs, which capture authenticated client requests and server responses
Vault server logs, which contain operational data, plugin errors, debug dumps, and critical security events
Audit logs can be sent to one or more audit devices, including local files, the local operating system's syslog framework, and remote log servers over raw UDP or TCP.
Server logs are sent to the systemd journal when using our standard OS packages for Redhat and Ubuntu or printed to stdout/stderr file handles when starting Vault in a terminal.
»Audit Logging Priority
Vault prioritizes audit log accuracy over service availability. Once you configure an audit device, Vault must be able to persist an audit entry to at least one audit device before each client request is serviced. If all of your configured audit devices are unavailable, the Vault client requests will hang until the requests can be written to the log. This means that Vault availability is only as good as the combined availability of the configured audit log device(s).
This flowchart illustrates a simplified view of how client requests, responses, and their associated audit logs are handled in Vault. A working audit device is required at each purple box for request handling to proceed.
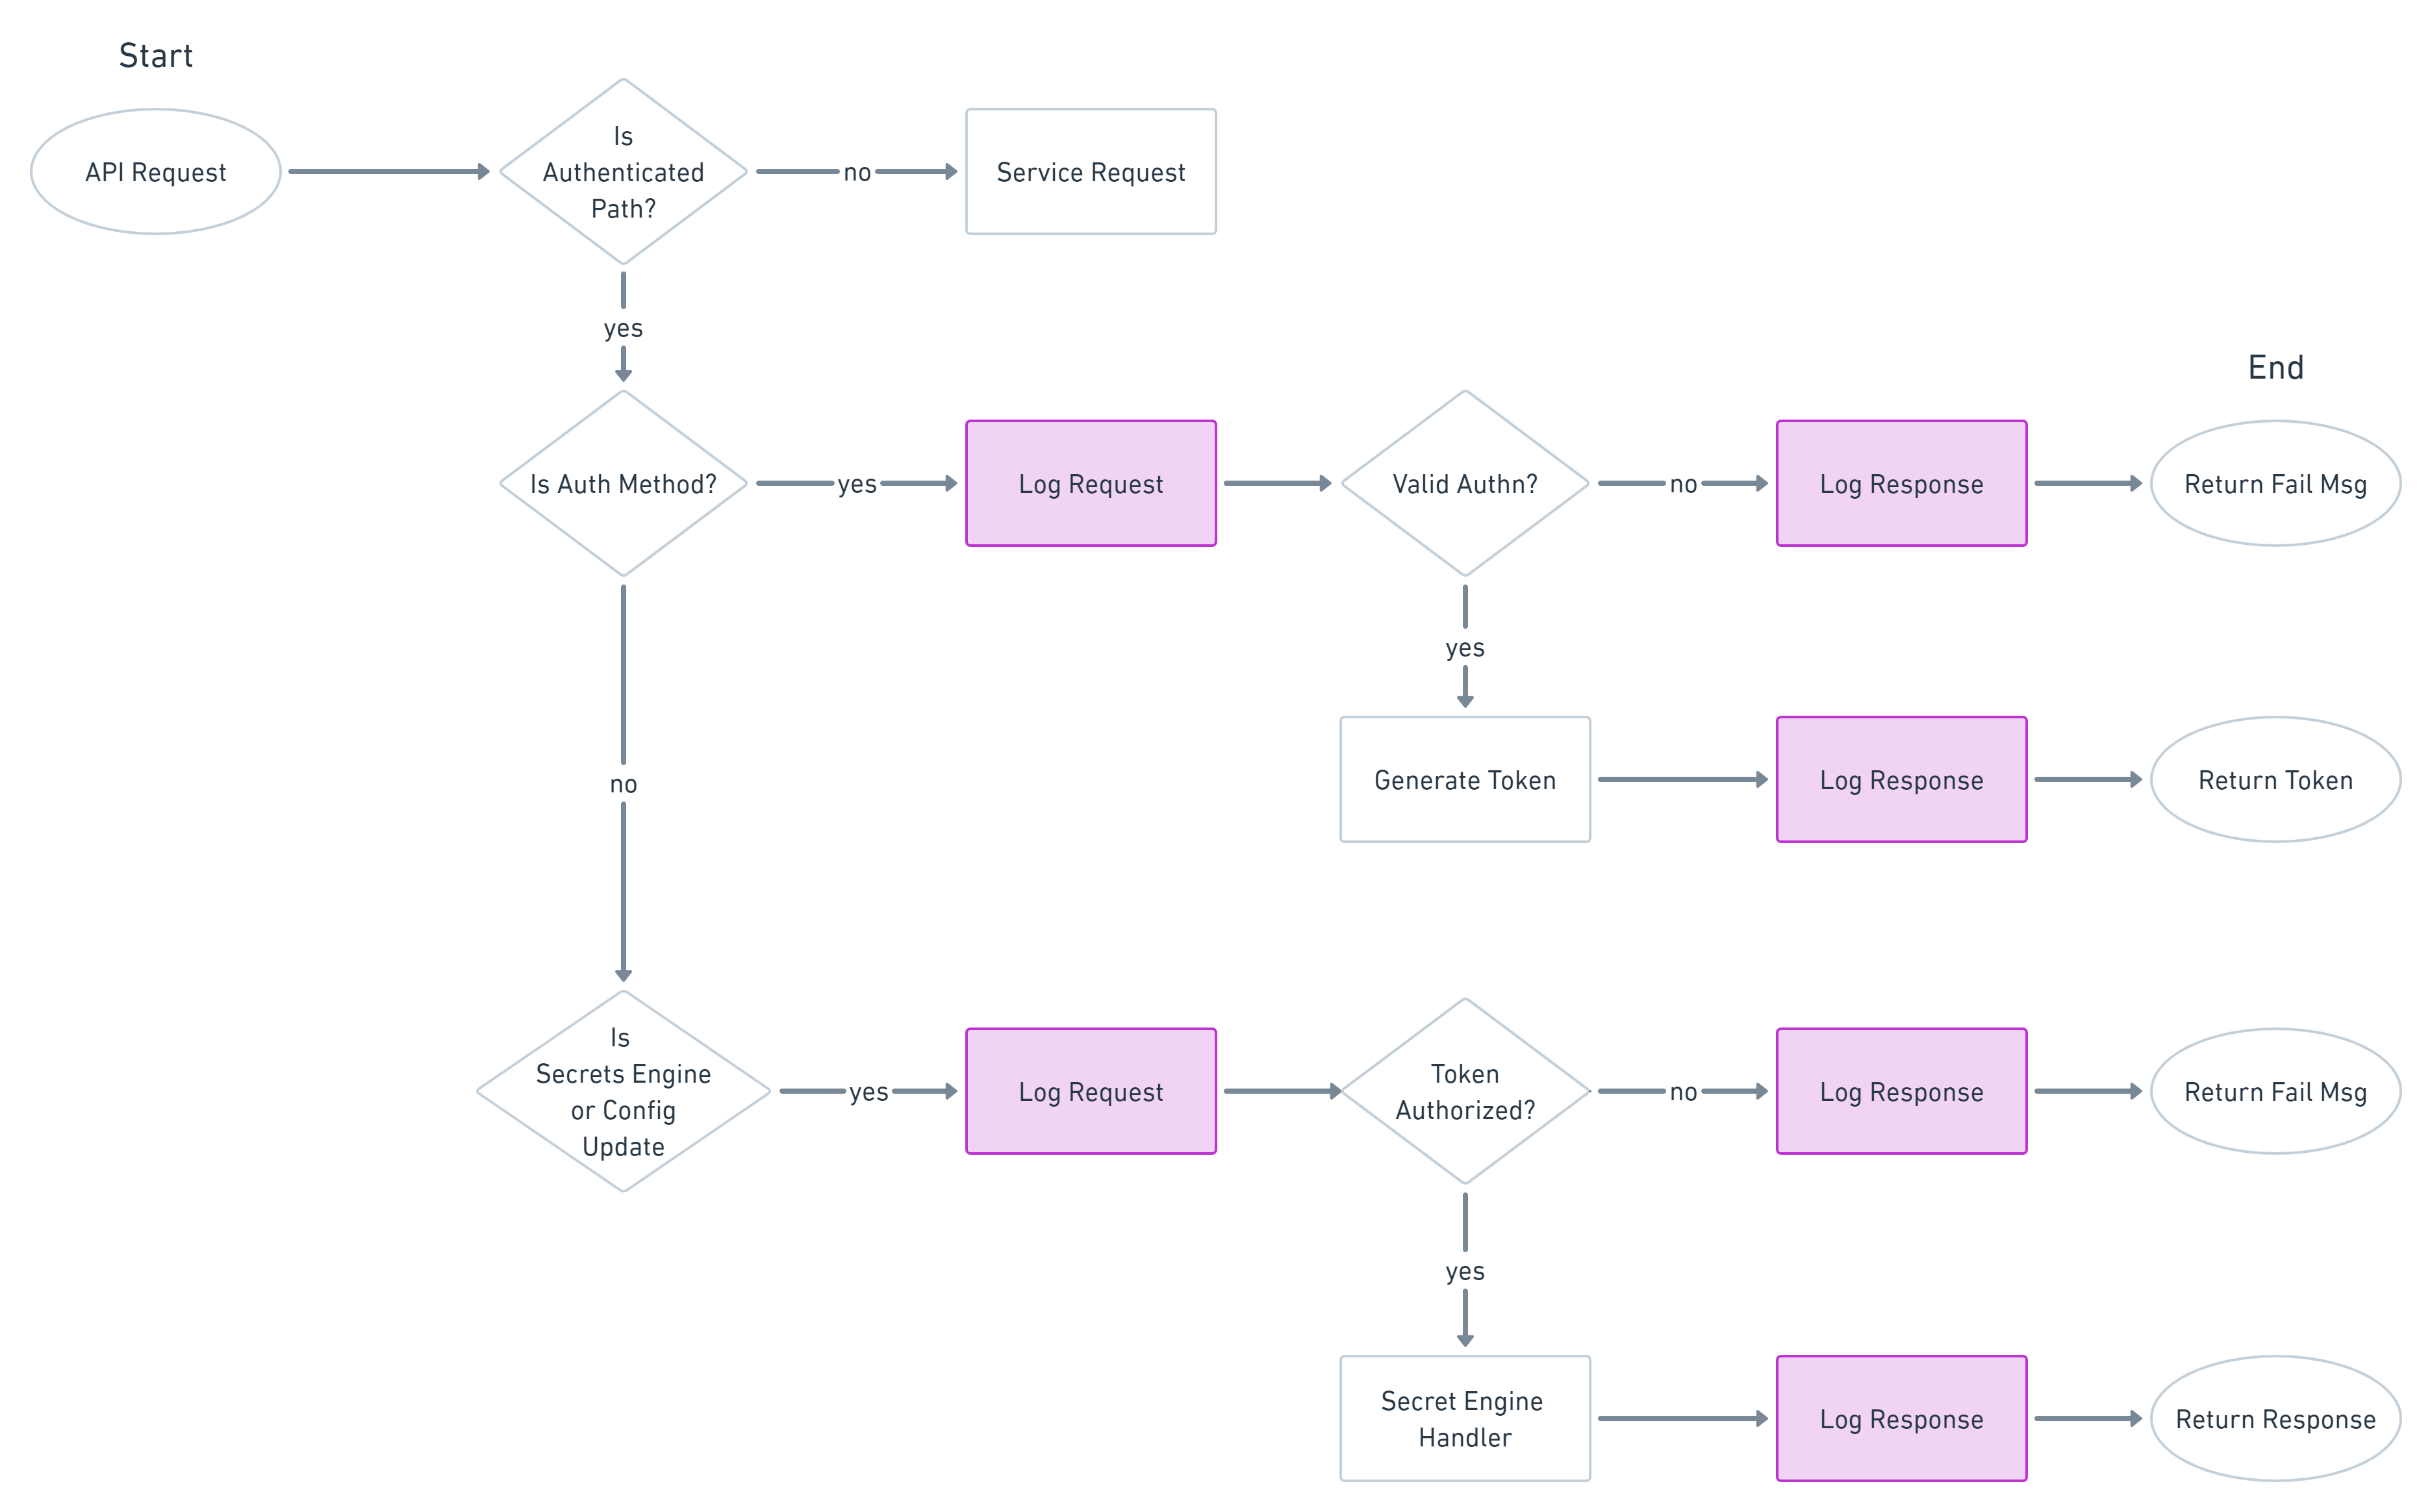
Vault API request and audit log process flow.
»Common Problematic Options
»Local File Only
Enabling a local audit file is where most people start because it's the easiest option with no external dependencies, and it requires only one command.
But this approach also has downsides:
Reading local audit files requires SSH access to Vault nodes, which violates the extended Vault production hardening guidelines.
Reviewing separate audit log files individually is cumbersome.
Filesystems can fill quickly when Vault is under high load, when executing benchmark tests, or if misbehaving clients flood the cluster with requests in an infinite loop. This causes a Vault service outage.
»Local File, Read by Forwarder
Forwarding logs from a local audit file to a network log server (with tools like Logstash or Promtail) simplifies analysis and review in a central location, but filesystems can still fill quickly under load, especially if the local file is rotated only hourly or daily.
»Syslog
Sending audit logs through the operating system syslog interface prepends messages with hostname and timestamp headers, which prevents operators from easily parsing raw logs with standard JSON tools like jq.
»Socket-to-Remote Log Server
Pointing Vault nodes directly to a network log server with the socket audit device provides easy centralized review, retains valid JSON format, and eliminates the potential to fill a local filesystem, but it causes Vault downtime when the log server is not responsive. This is unacceptable for many organizations.
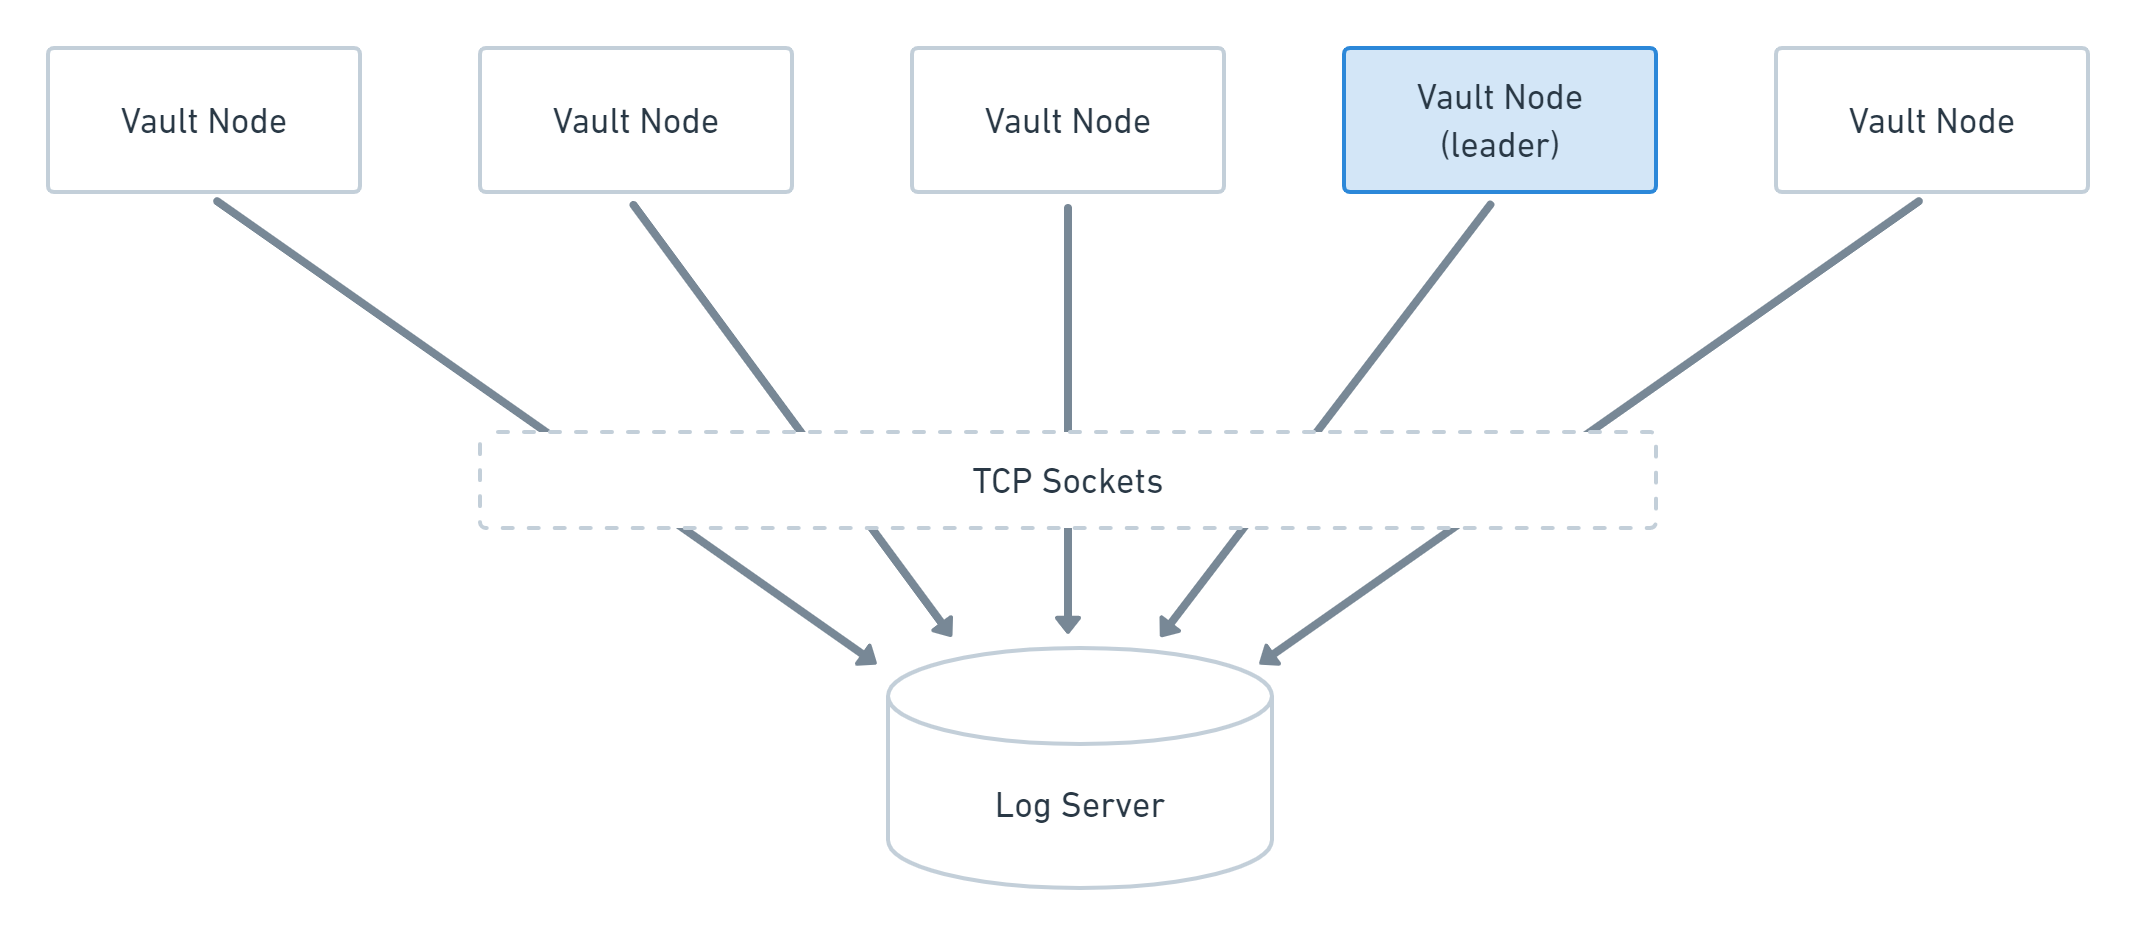
Vault cluster with socket audit devices enabled for central log server.
»A Better Option
»Local Socket Buffer
Logging strategies are debated between HashiCorp engineers, but perhaps the best option is to run a forwarding syslog-ng daemon on each Vault node. This daemon is configured to forward audit logs directly to a centralized log server and buffer log messages to disk only when the remote server is unavailable.
Analysis, alerting, and any other resource-intensive tasks can be performed on the remote log server while keeping the Vault node as simple and reliable as possible.
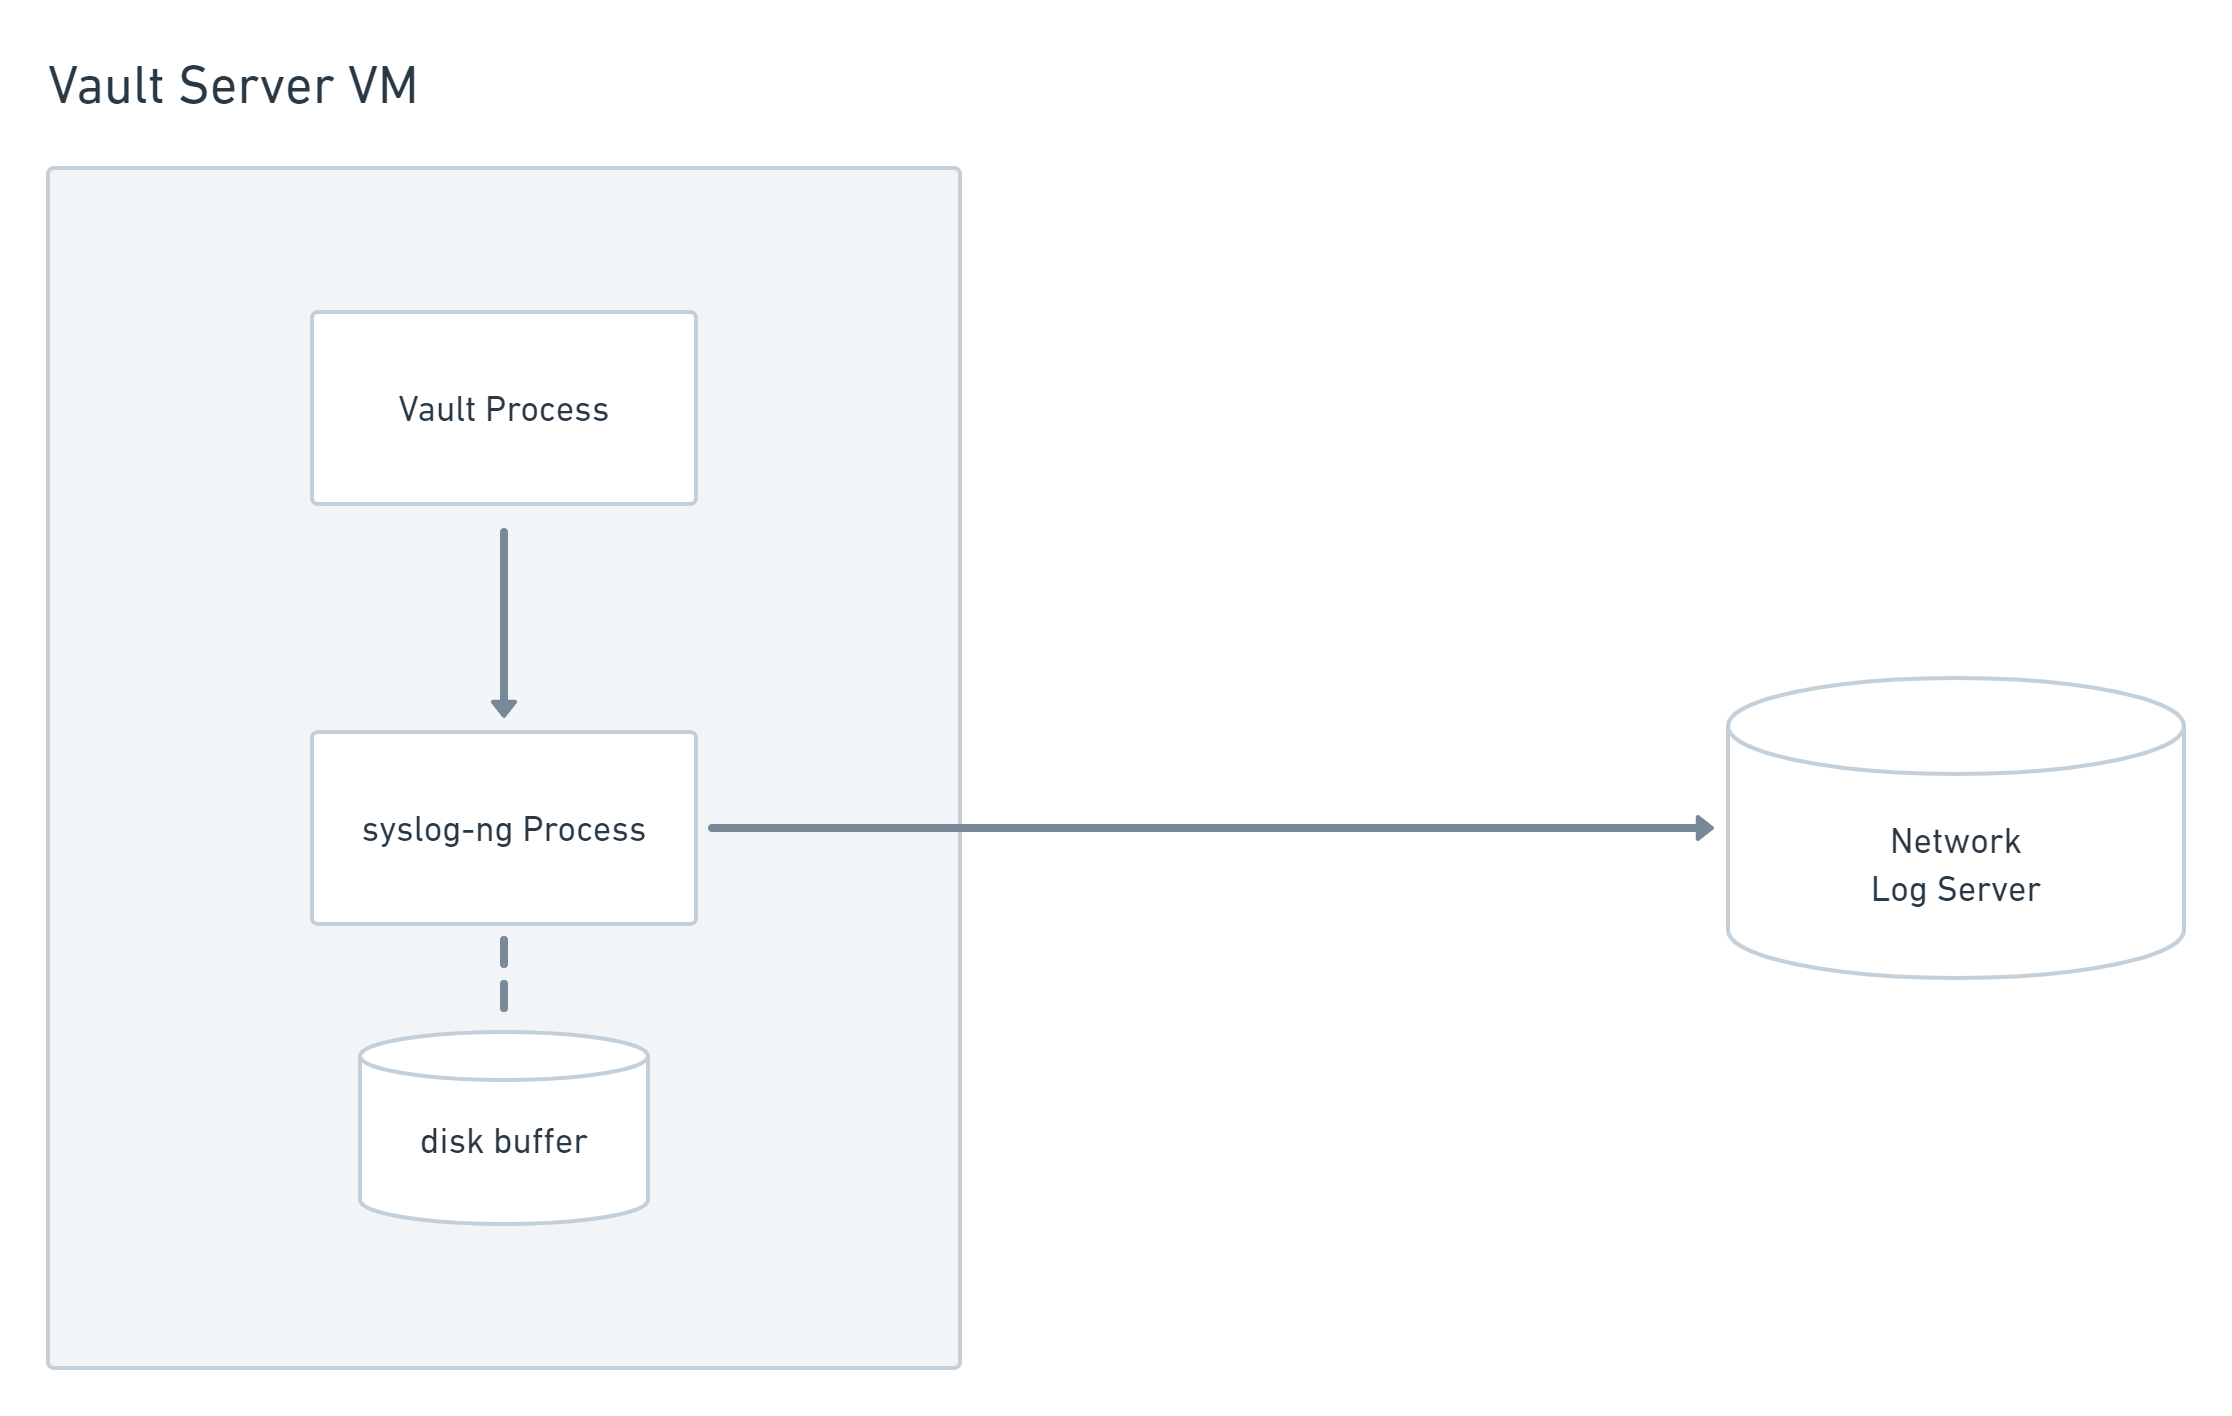
Vault node logging to network log server through local syslog-ng buffer.
This provides several benefits:
Vault continues to serve requests when the central log server is down.
Log messages are retained and sent to the log server when it comes back online.
Messages retain valid JSON format for easy parsing.
Messages are aggregated for easy review and processing in one place.
Messages touch the Vault server filesystem only in the rare event that the log server is down, so the risk of filesystem issues under load is greatly reduced.
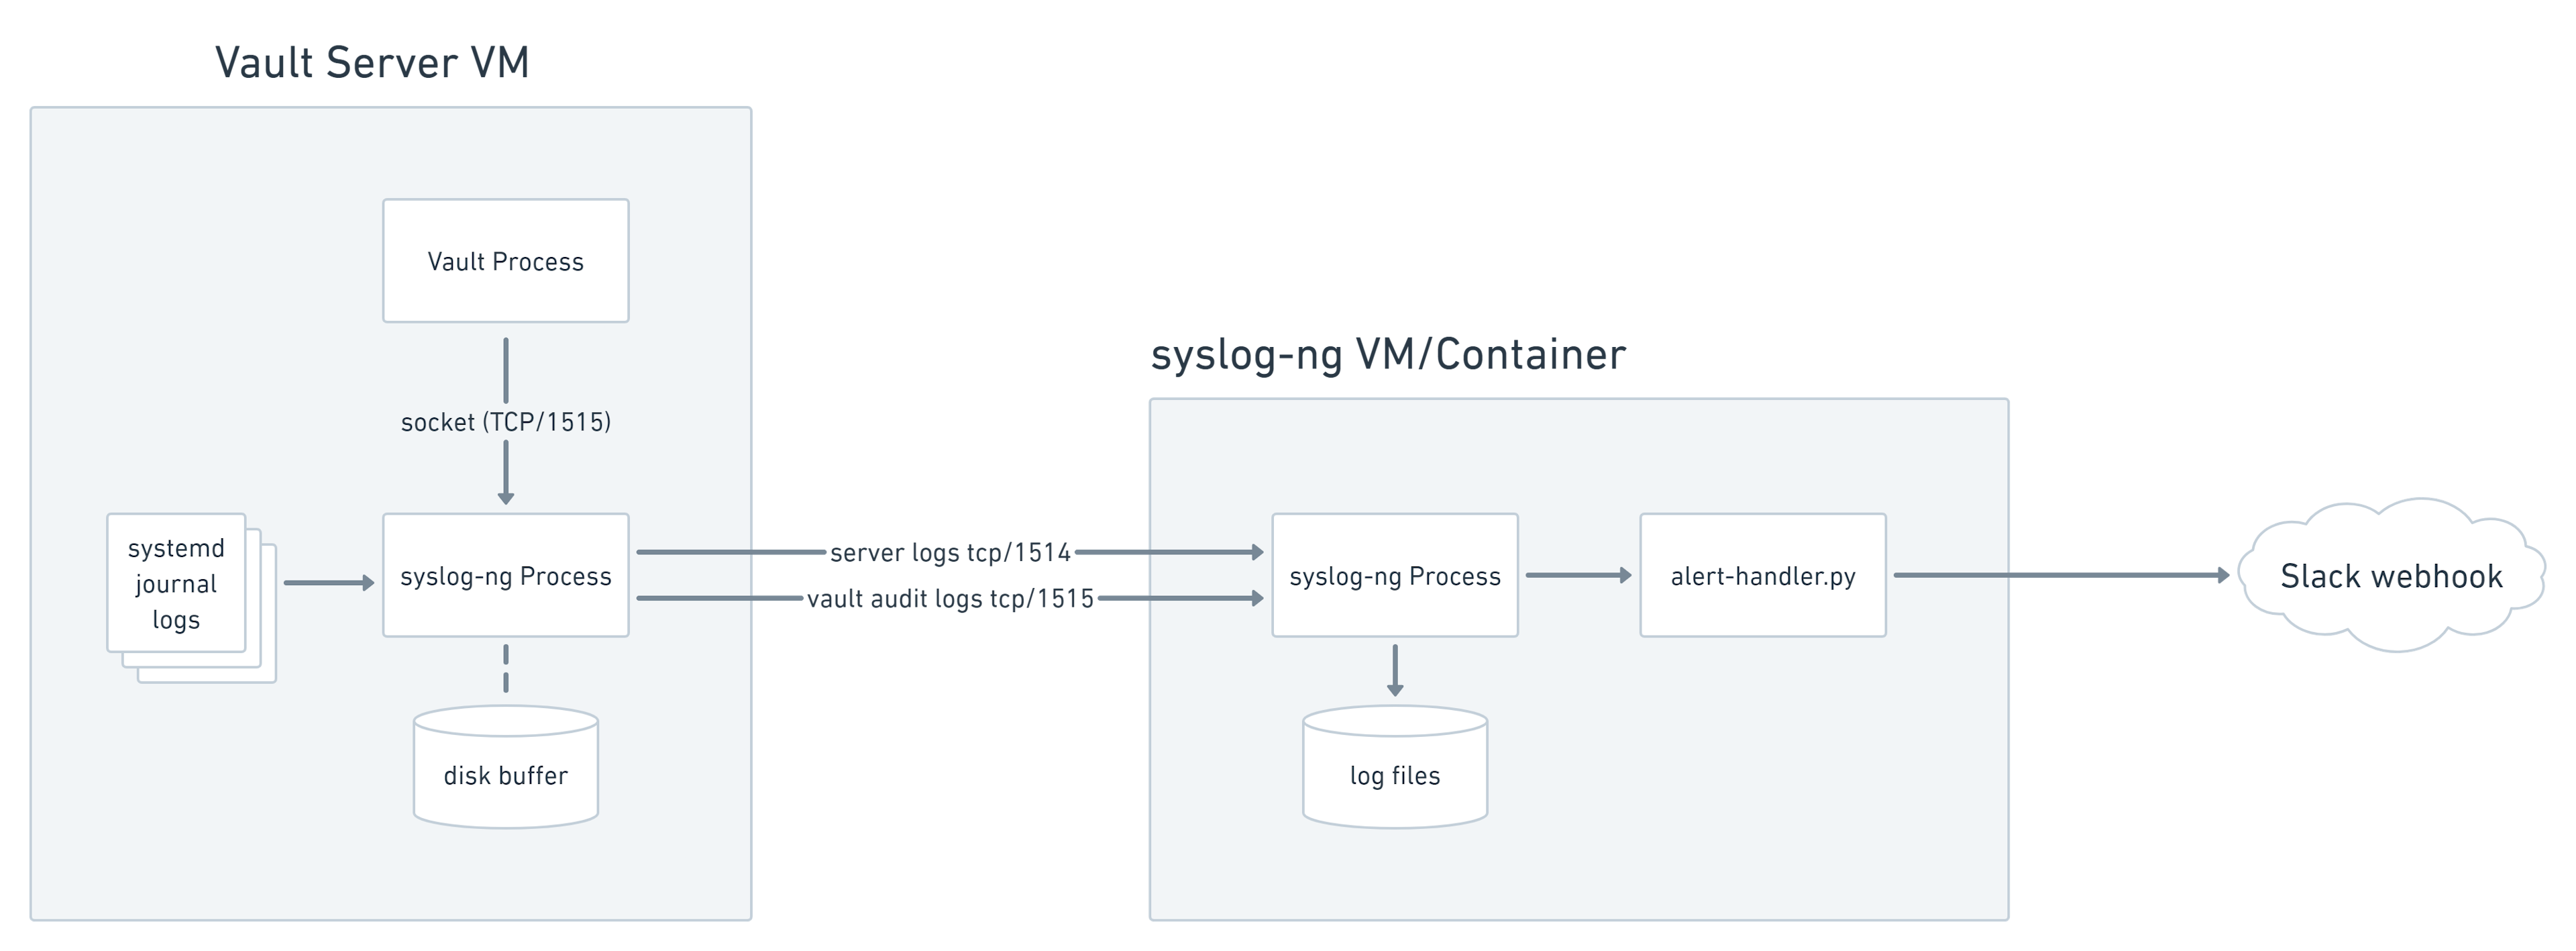
Because Vault logs audit messages in JSON format and server logs as traditional unstructured text, sending them to separate listeners on the log server simplifies parsing and alerting. This example uses syslog-ng for the log server.
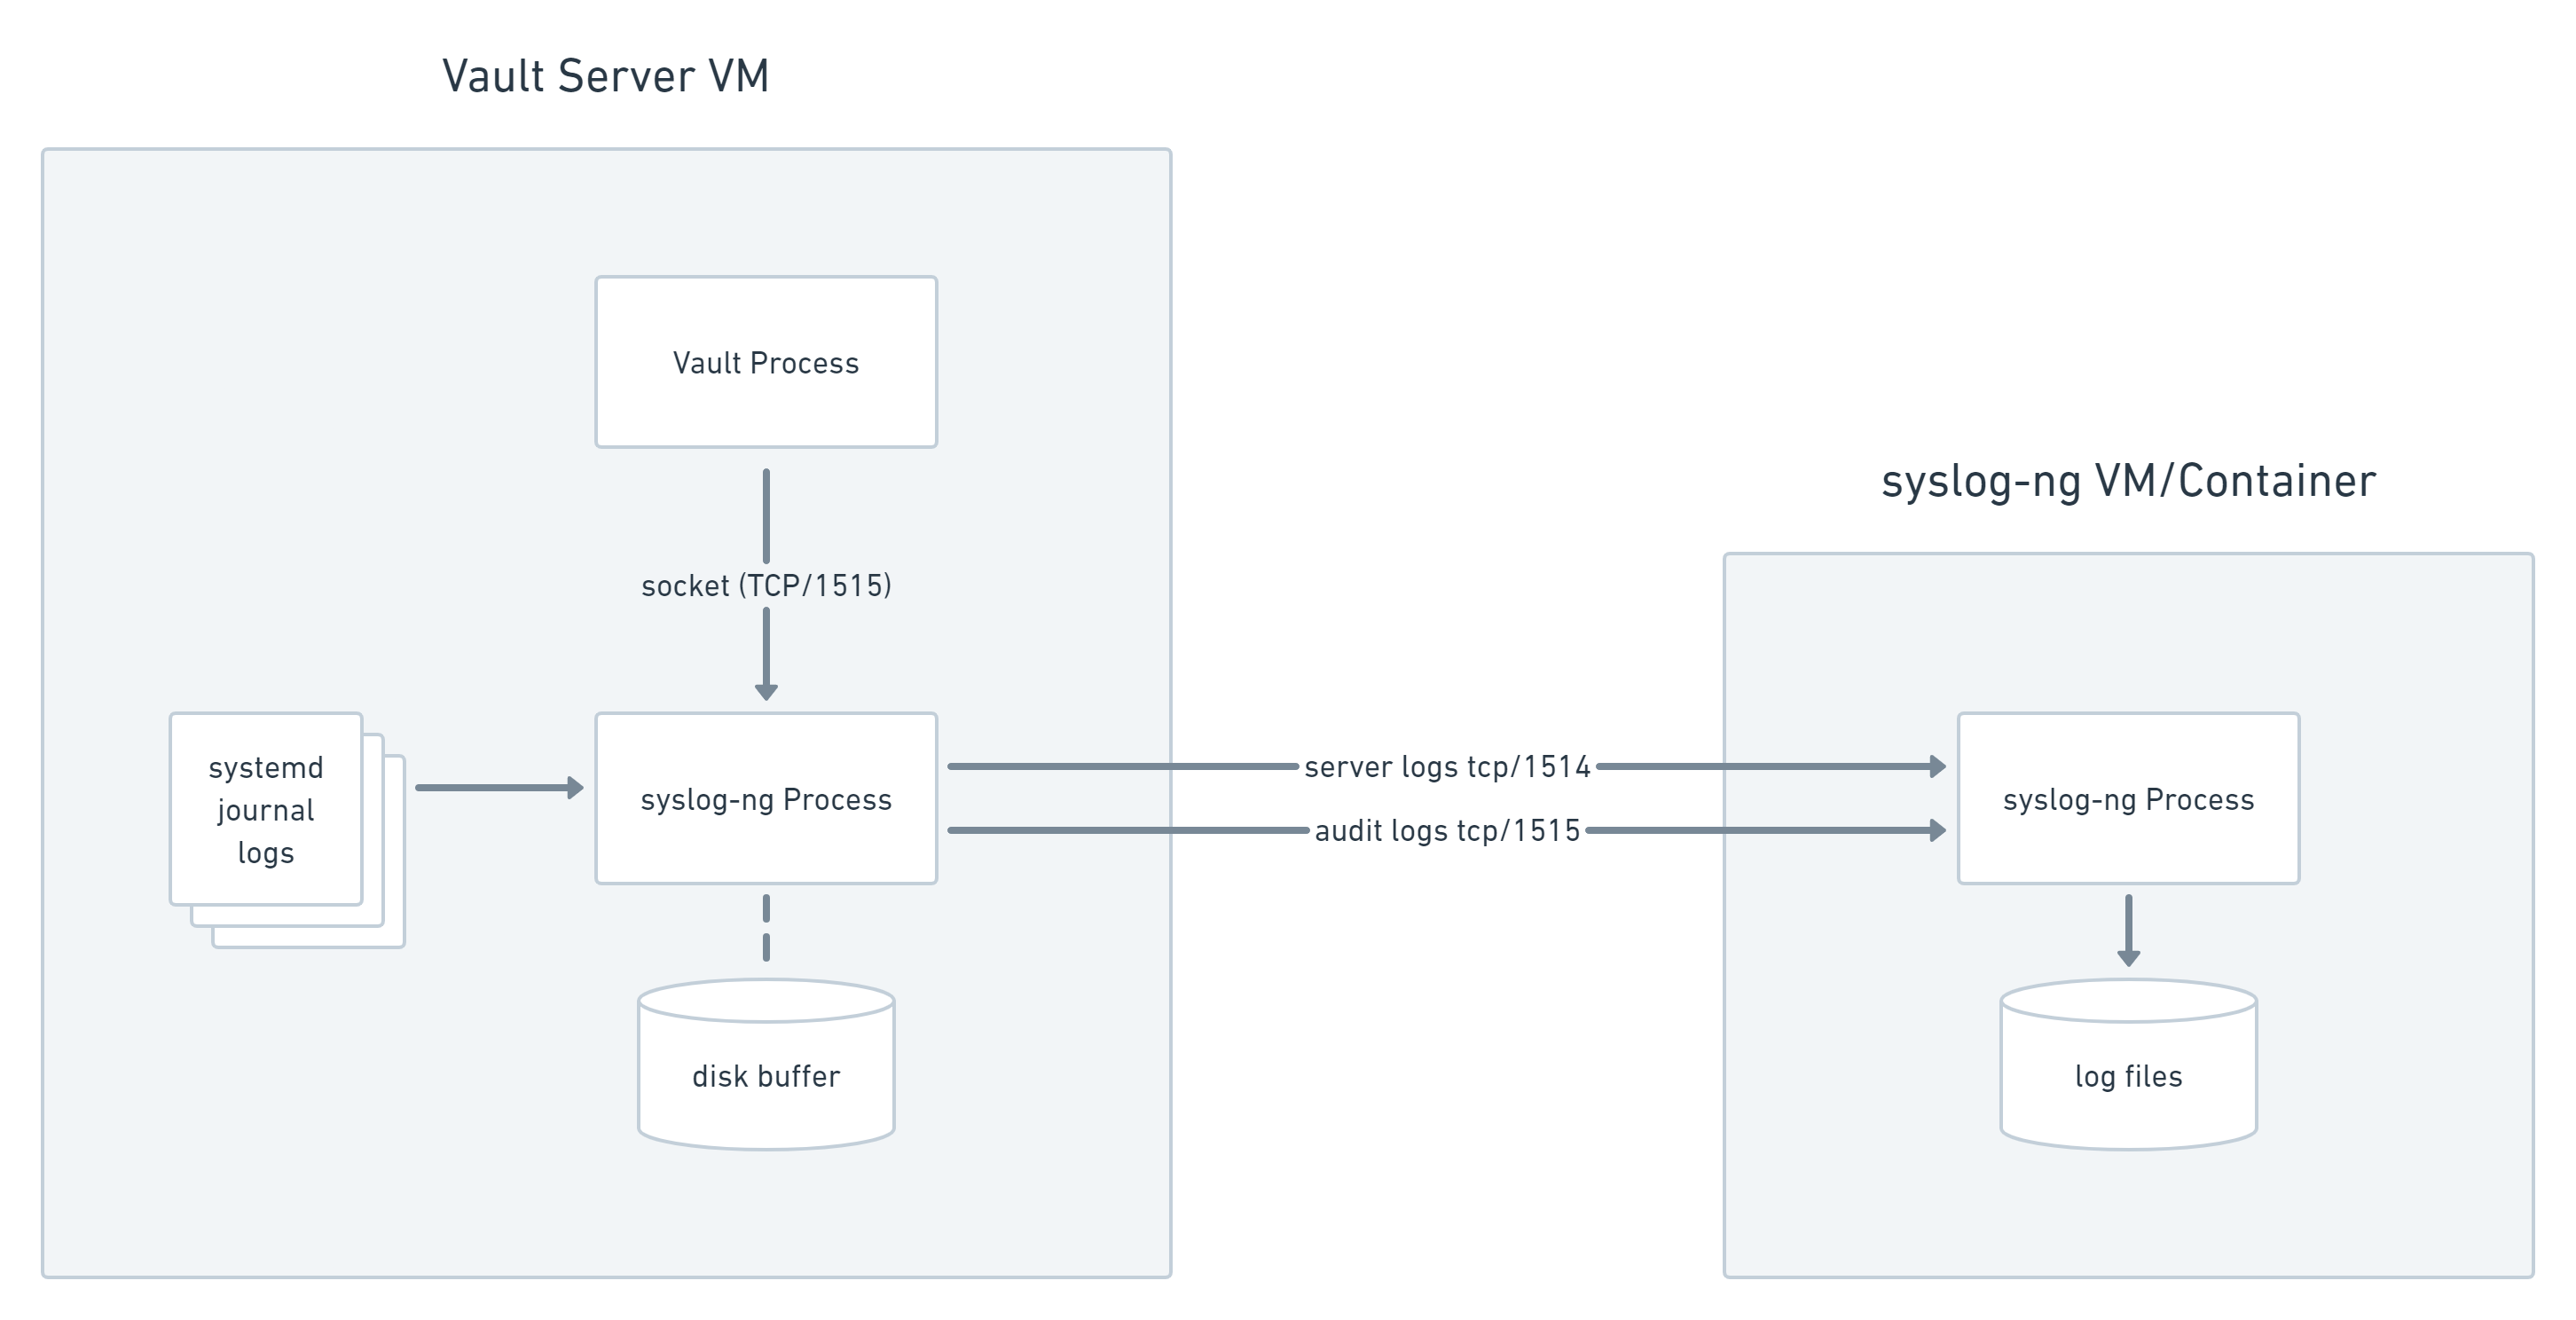
Syslog-ng forwarding Vault audit logs and systemd journal to remote syslog-ng server.
Once the cluster logs are received and persisted to disk by the central syslog-ng instance, syslog-ng's program() driver can send log messages to separate processes for analysis and alerting. One Python script performs regex matching on Vault's unstructured server logs. A second script parses JSON audit logs into Python dictionary objects and alerts on conditions in each message.
When the Python scripts identify security events, they post notifications to a Slack webhook for real-time operator visibility, as well as writing them to an alert log for long-term archiving on the system-ng instance.

Vault server to remote syslog-ng with Slack notifications.
»Syslog-ng Parsing
I initially attempted to do this with syslog-ng filters and the included JSON parser, but found the docs difficult to follow and configure correctly. I chose to implement the message parsing and alerting logic in Python to keep the syslog-ng configs as simple as possible, easy to understand, and reliable.
This can easily be expanded to send messages into:
AWS SNS
Azure Service Bus
Google Cloud Pub/Sub
Microsoft Teams
Webex Teams, etc.
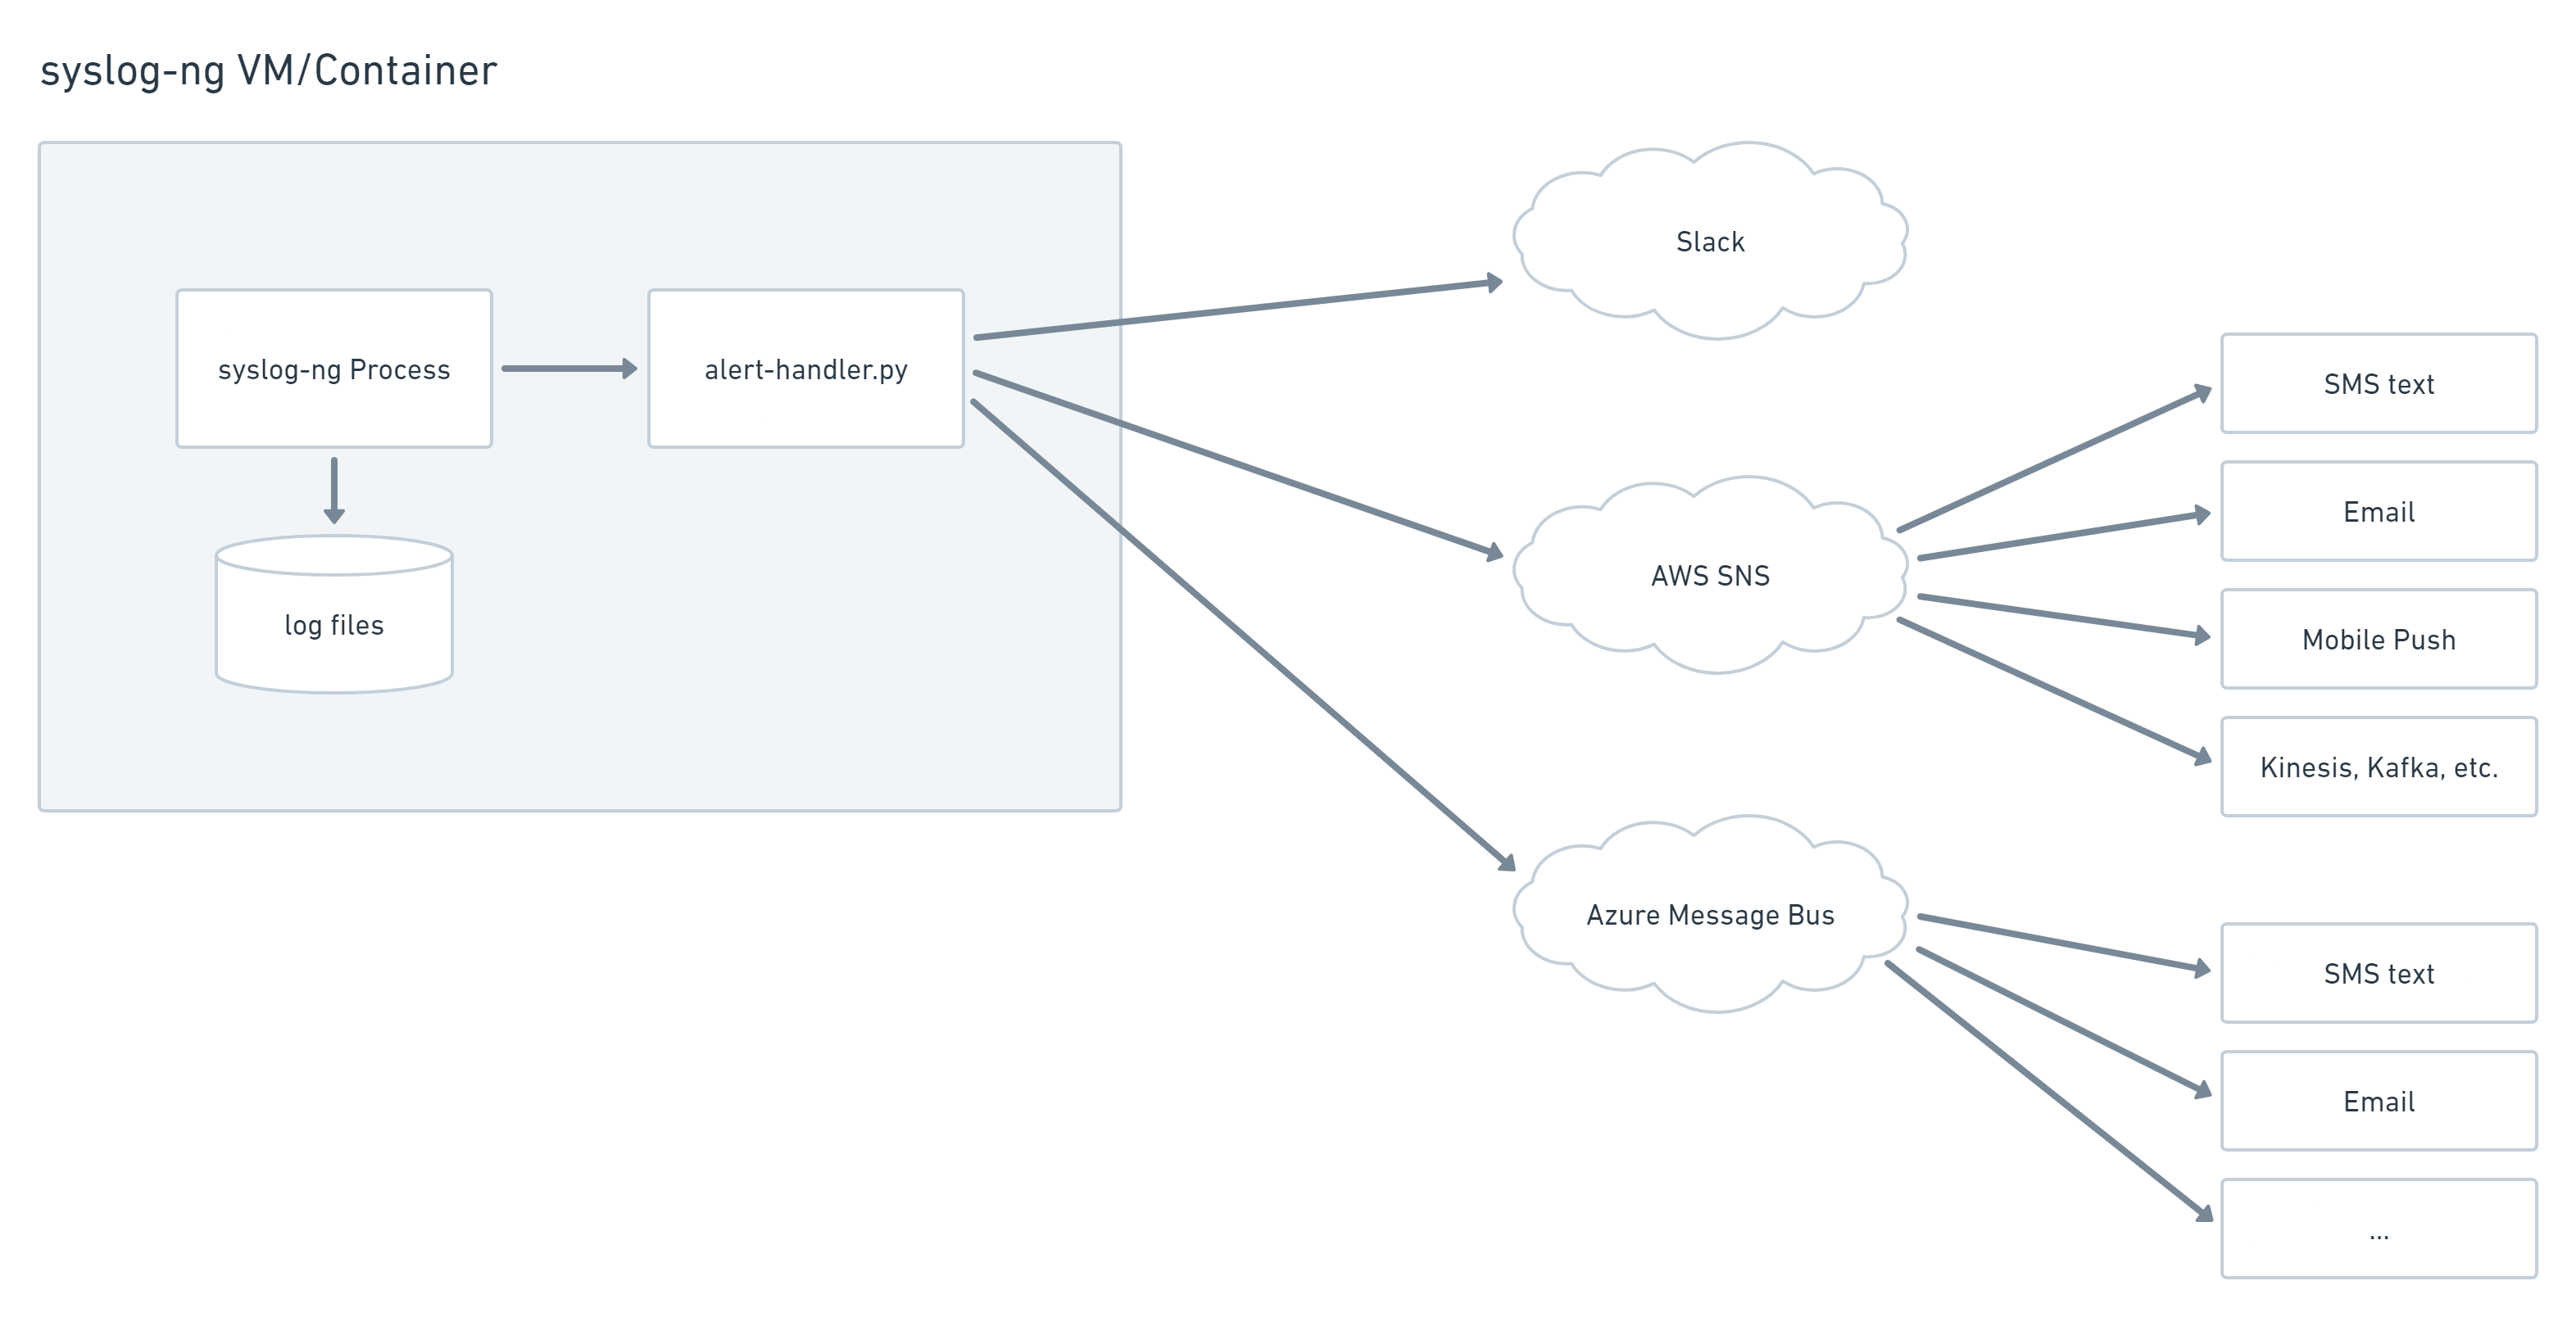
syslog-ng program() handler sending to multiple destinations, AWS SNS, Azure Message Bus, Slack, etc.
»Deploying the Solution with Terraform Code
The Terraform code in this post’s companion GitHub repo will deploy a single Vault node with a local socket buffer and a syslog-ng network log server so you can see this solution in action and test it in your environment:
git clone https://github.com/jacobm3/vault-syslog-ng-audit
cd terraform
The deployment includes the following resources:
A single Vault virtual machine
Ubuntu 22.04 LTS
Latest Vault open source software installed with the HashiCorp-maintained Ubuntu package
Initialized with a single unseal key, stored locally (for simple non-production use)
Syslog-ng listening on localhost, configured to buffer audit logs and forward to the log server
A syslog-ng log server
Ubuntu 22.04 LTS
TCP/1514 listener for unstructured application logs
TCP/1515 listener for JSON audit logs
Python scripts to send Slack alerts on critical security events in daemon and audit logs
»Prerequisites
Update terraform.tfvars with the required values for your account:
vpc_id       = "vpc-4f778c2a"
ec2_key_pair = "acer-wsl"
If you want to send event notifications to Slack, set the webhook URL as an environment variable. This URL contains an embedded authorization token tied to your workspace, so don't check this into version control.
export TF_VAR_slack_notif_url=https://hooks.slack.com/services/T01aa/B0bbb/fgxDccc
If you don't already have a webhook for your Slack workspace, you can use this URL to create one: https://api.slack.com/apps?new_app=1&ref=bolt_start_hub
»Build
Run terraform apply:
terraform apply
…
Apply complete! Resources: 5 added, 0 changed, 0 destroyed.

Outputs:

syslog_instance_id = "i-01cc80a56f8cf2249"
syslog_public_ip = "3.82.108.94"
vault_instance_id = "i-025e4ed2a0bc2a5dc"
vault_public_ip = "3.83.65.29"
Wait a few minutes for the cloud-init scripts to complete and if everything worked correctly you should see notifications in your Slack channel:
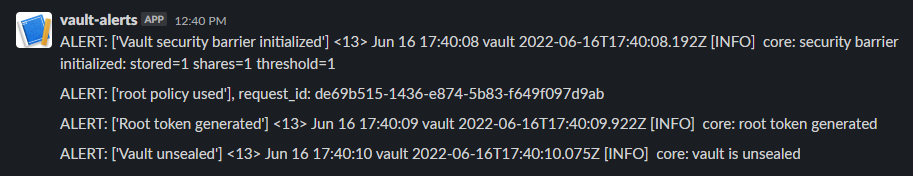
Sample Vault event notifications sent to Slack.
»Config Review
Note: These configs are known to work with Ubuntu 22.04 LTS. Adjustments may be needed for other releases or distributions.
The syslog-ng configs are commented to explain the purpose of key parameters. Here are some sections for review:
»Vault Instance
Navigate to /etc/syslog-ng/conf.d on the Vault instance and view vault.conf.
The configuration block below creates a raw TCP listener on port 1515 without applying any syslog message parsing. It listens only on the loopback interface, so unauthorized clients outside the Vault instance can't send messages to it.
# Raw TCP input listening only on loopback interface
source s_vault_tcp {
         network(
           flags(no-parse)
           log-msg-size(268435456)
           ip(127.0.0.1)
           transport(tcp)
           port(1515));
       };
The next block creates a remote logging destination pointing to the syslog-ng instance. The ${syslog_ip} variable will be populated during terraform apply and contain the syslog-ng instance private IP address. It also creates a disk buffer that will be used to store up to 4GB of audit log messages in the event the downstream syslog-ng service is unavailable. This is the key feature that provides Vault service resiliency during log server outages.
# Send audit logs to log server on TCP/1515
# 4GB disk buffer, only used when log server is down
destination d_remote_audit {
    tcp("${syslog_ip}"
        port(1515)
        template(t_imp)
        disk-buffer(
            mem-buf-length(10000)
            disk-buf-size(4000000000)
            truncate-size-ratio(0.1)
        )
    );
};
The Vault instance syslog-ng config includes a template reference to the private IP address of the syslog-ng server and is defined here.
»Syslog-ng Instance
Navigate to /etc/syslog-ng/conf.d on the syslog-ng instance and view vault.conf:
# Uncomment these lines and configure /usr/local/etc/vault-log-handler.ini
# if you want to send notifications to Slack
# Then restart syslog-ng: sudo systemctl restart syslog-ng
#
destination d_prog_json { program("/usr/local/bin/vault-audit-log-handler.py" template("$MSG\n") ); };

destination d_prog_syslog { program("/usr/local/bin/vault-server-log-handler.py" template("<${PRI}> ${DATE} ${HOST} ${MESSAGE}\n") ); };

log { source(s_vault_tcp); destination(d_prog_json); };
log { source(s_messages_tcp); destination(d_prog_syslog); };
The destination … program() lines create destination targets that launch the specified Python scripts and pass new messages into the stdin filehandles of each script as the messages arrive. The scripts will be restarted automatically if they exit.
syslog-ng retains the raw audit log message body according to the specified template, so stored messages can be parsed with JSON tools. We include standard syslog fields for the unstructured server logs.
The syslog-ng server config is defined here.
»Log Rotation
syslog-ng captures Vault audit logs, server logs, and generated alert logs to /var/log/vault on the syslog-ng instance.
auditcontains Vault audit logs.
audit.alertcontains a record of alerts generated from the audit log.
messagescontains the Vault application logs from the systemd journal.
messages.alertcontains a record of alerts generated from the Vault application logs.
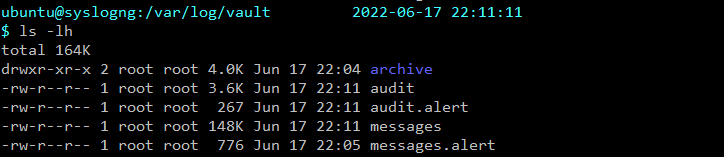
Vault logs in /var/log/vault.
Each of the above log files will be rotated, compressed, and stored in the archive sub-directory.
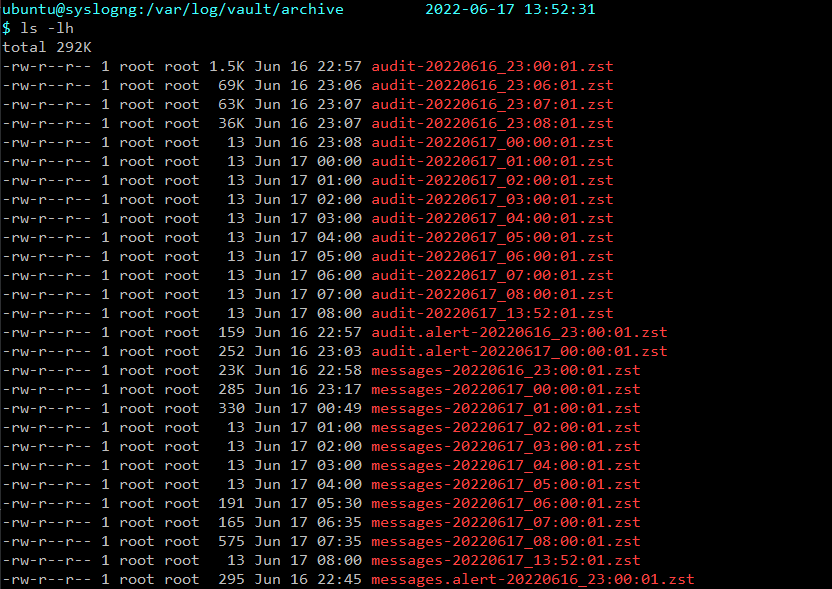
Archived logs in /var/log/vault/archive.
A logrotate cron entry is used to rotate all the Vault-related log and alert files into /var/log/vault/archive:
ubuntu@syslogng:/etc         2022-06-16 20:26:20
$ cat /etc/cron.d/logrotate-vault
* * * * * root /usr/sbin/logrotate /etc/logrotate.d/vault-syslog-ng

ubuntu@syslogng:/etc         2022-06-16 20:26:28
$ cat /etc/logrotate.d/vault-syslog-ng
compress
compresscmd /usr/bin/zstd
compressext .zst
uncompresscmd /usr/bin/unzstd

/var/log/vault/audit
/var/log/vault/audit.alert
/var/log/vault/messages
/var/log/vault/messages.alert
{
        rotate 2300
        hourly
        maxsize 1G
        dateext
        dateformat -%Y%m%d_%H:%M:%S
        missingok
        olddir /var/log/vault/archive
        postrotate
                invoke-rc.d syslog-ng reload > /dev/null
        endscript
}
This logrotate configuration rotates log files hourly, or when they reach 1GB, and compresses with Facebook's zstandard compression algorithm for better performance than gzip. You might prefer daily rotation for lower volume-environments. In that case, keep the "every minute" cron schedule and change the logrotate config from "hourly" to "daily".
»A Note About High-Volume Logs
Vault's KV engine is fast and can generate gigabytes of audit logs in less than a minute on fast hardware. This can fill a small filesystem during performance testing since cron can execute logrotate only once per minute.
This should be less of an issue with a centralized log server, which can be easily (re)sized appropriately. The log server's filesystem size is specified in this section of the solution repo:
 root_block_device {
    # size in GiB. Set high if you plan to perform Vault benchmark tests which
    # can fill a disk quickly
    volume_size = 20
  }
Resizing Note: Amazon EC2 block devices and instance types can be resized without destroying the instance, provided you keep the same AMI and CPU architecture. The Terraform AWS provider stops the instance, resizes, and restarts the instance, which comes back up on the same IP address.
»Long-Term Archive
You can also add a cron entry to sync the archive directory to S3 Infrequent Access or Glacier for cheap long-term storage:
aws s3 sync /var/log/vault/archive s3://some-bucket/archive --storage-class STANDARD_IA
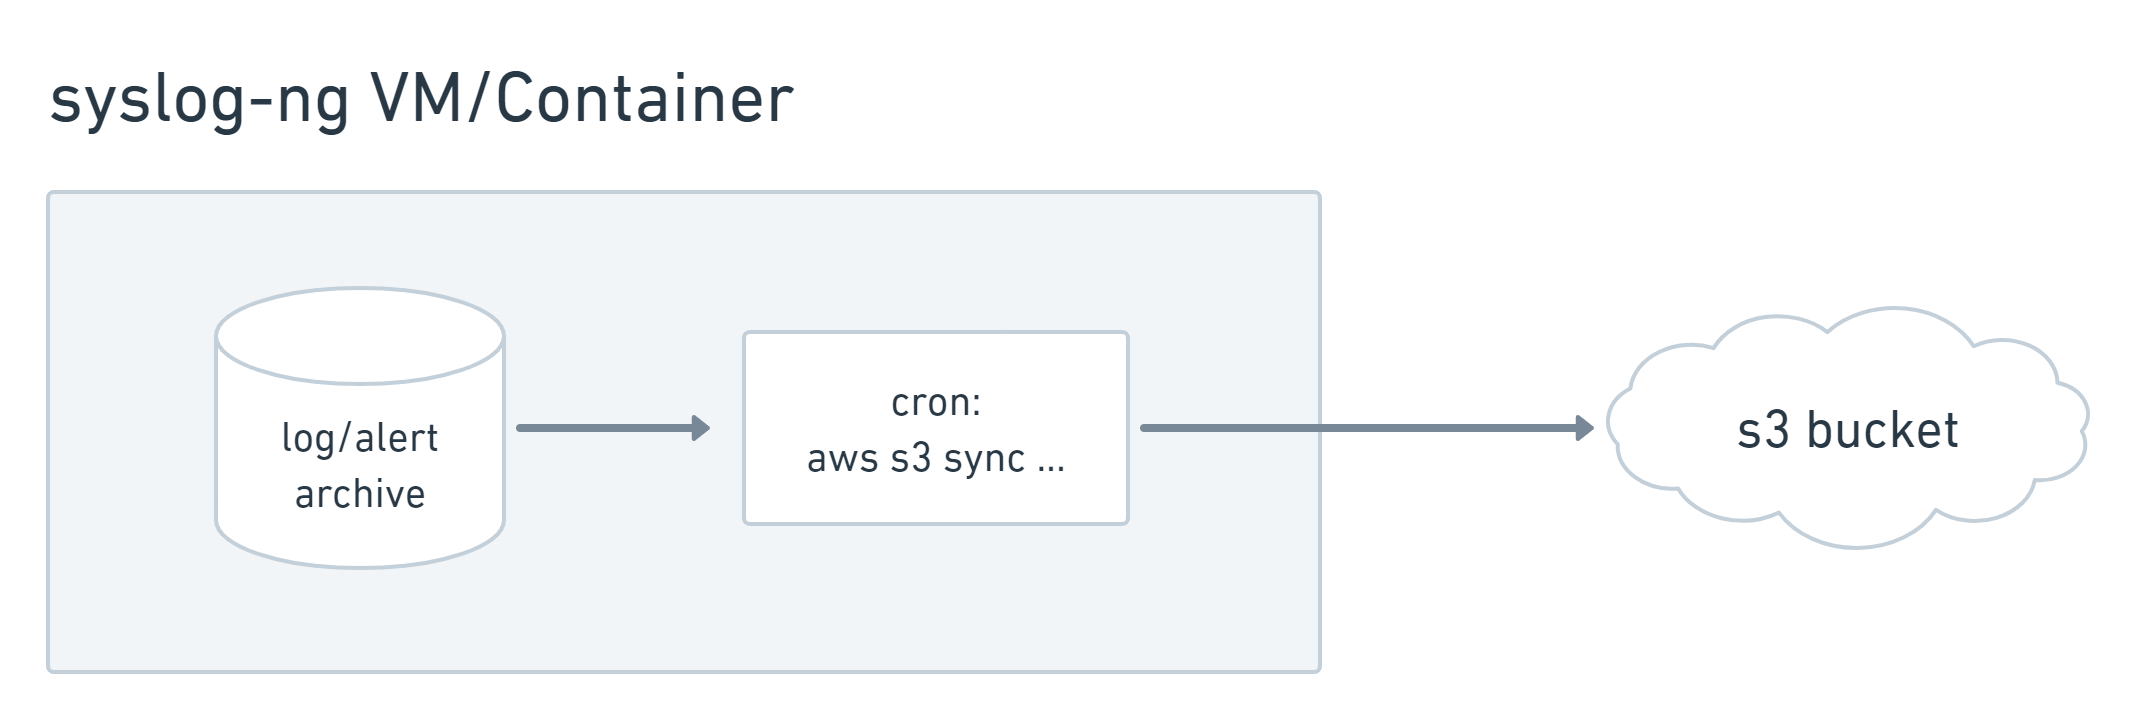
Archiving logs and alerts to an s3 bucket for inexpensive long term storage.
»Message Parsing and Event Definitions
syslog-ng's program() driver streams incoming messages for each input source to the stdin file handle of the appropriate Python script. This is a common pattern for looping over stdin lines in Python:
Repo file: vault-server-log-handler.py (line 85)
def read_stdin():
    ln = sys.stdin.readline().rstrip()
    while ln:
        try:
            check(ln)
        except Exception as e:
            pass
        ln = sys.stdin.readline().rstrip()
The unstructured log handler uses a list of regular expressions and event labels to define which events should generate alerts and how to label them. These are important log entries for every environment. Check the latest from the main branch on this repo for alert definition updates.
Repo file: vault-server-log-handler.py (line 12)
# list of regex object/alert msg tuples which will be used to identify alert conditions
alert_re_list = []
alert_re_list.append((re.compile(r'vault.*root token generated'),
                                'Root token generated'))

alert_re_list.append((re.compile(r'vault.*enabled credential backend'),
                                'Auth method enabled'))

alert_re_list.append((re.compile(r'vault.*vault is sealed'),
                                'Vault sealed'))

alert_re_list.append((re.compile(r'vault.*vault is unsealed'),
                                'Vault unsealed'))

alert_re_list.append((re.compile(r'vault.*Vault shutdown triggered'),
                                'Vault shutdown'))

alert_re_list.append((re.compile(r'vault.*root generation initialized'),
                                'Root token generation initiated'))

alert_re_list.append((re.compile(r'vault.*root generation finished'),
                                'Root token generation finished'))

alert_re_list.append((re.compile(r'vault.*core: rekey initialized'),
                                'Vault security barrier rekey process initialized'))

alert_re_list.append((re.compile(r'vault.*core: security barrier rekeyed'),
                                'Vault security barrier successfully rekeyed'))

alert_re_list.append((re.compile(r'vault.*core: security barrier initialized'),
                                'Vault security barrier initialized'))
The JSON audit log handler makes all the audit log fields available as a Python dictionary so you can create arbitrary alert conditions, such as field values or time of day. You can also interface with external systems through other Python SDKs, REST APIs, etc.
To make things easier, I’ve created a couple rules in the GitHub repository, including a simple string match looking for root token generation:
 if path.startswith('sys/generate-root'):
            alert_msgs.append('Root token generation path accessed: %s' % path)
And a match looking for a sensitive KV path in a specific namespace:
if namespace == 'prod/' and path.startswith('secret/data/never-use'):
            alert_msgs.append('namespace %s, path %s accessed' % ('prod',path))
»Sending Notifications
Sending an alert to Slack is simple with the Python requests module. You append the alert message to a local file for permanent storage, then POST to the configured Slack webhook:
def alert_slack(msg):
    with open('/var/log/vault/messages.alert', "a") as f:
        f.write(msg)
    try:
        payload = '{"text":"%s"}' % msg
        headers = {'Content-type': 'application/json'}
        r = requests.post(config['slack']['url'], headers=headers, data=payload)
    except Exception as e:
        print(e)
»Summary
This solution provides centralized network log storage, durable long-term archiving, and alert notifications for critical Vault events. It costs only a few dollars a month in AWS compute charges for small installations.
This is an opinionated framework and is intended to serve as a starting point for teams that don't have access to a highly available logging and alerting system or that aren't sure which events should be monitored. It can also be useful for anyone who needs centralized logging without impacting Vault availability. I hope you find it valuable. Feel free to reach out to me in this HashiCorp Discuss Forum thread or your regional HashiCorp solutions engineer if you have any questions!


