At New Relic, we are heavy users of HashiCorp Terraform, which we use to provision all kinds of infrastructure and services, including New Relic dashboards and alerts. Terraform providers are a big efficiency driver for us and for our customers that use Terraform to automate New Relic setup in their infrastructures. One of our customers, 27Global, described their efficiency gains through Terraform well:
"Historically, our cloud engineers would need to manually add monitoring to the infrastructure, and our developers would have to build monitoring into the applications. Now, using the Terraform Provider from New Relic, we take advantage of APIs to automatically add monitoring to our applications and infrastructure." — Thomas Martin, Director of Site Reliability at 27Global
In this guide, you’ll learn how to use the New Relic Terraform Provider on Terraform Cloud. We’ll walk through how to provision an alert policy, create four alert conditions, and set up a notification channel. The alert conditions are based on the Four Golden Signals of monitoring introduced in Google’s Site Reliability Engineering book.
»The Four Golden Signals
Latency: The amount of time it takes your application to service a request.
Traffic: The number of requests your system receives.
Errors: The rate of requests that fail.
Saturation: The stress on resources to meet the demands of your application.
»The Advantages of Using Terraform Cloud
Once our New Relic alerts are set up with Terraform, you will be able to integrate Terraform Cloud into your workflow.
With Terraform Cloud, you gain several advantages in maintaining your Terraform configuration locally. Terraform Cloud offers remote execution of your Terraform plans, remote state management, and provides a solid foundation to scale up as your team and infrastructure grow.
»Video Tutorial
If you want to follow along via video to set up Terraform on your local machine first, feel free to check out the getting started video my colleague Jon Thurman put together.
»Before You Begin
To use this guide, you should have some basic knowledge of both New Relic and Terraform. You will need to create a Terraform Cloud account if you don’t already have one. You will want to create a new GitHub repository so you can sync your code changes to Terraform Cloud. If you haven't deployed a New Relic open source agent yet, install New Relic for your application. Also, install the Terraform CLI.
»Bootstrap Terraform and the New Relic Provider
Start by cloning your new GitHub repository into a directory named terraform-project, initialize the working directory, and create a Terraform configuration file:
git clone  terraform-project
cd terraform-project
touch main.tf
Next, instruct Terraform to install and use the New Relic provider, by setting the terraform and required_providers blocks in main.tf:
terraform {
  # Require Terraform version 0.13.x (recommended)
  required_version = "~> 0.13.0"

  # Require the latest 2.x version of the New Relic provider
  required_providers {
    newrelic = {
      source  = "newrelic/newrelic"
      version = "~> 2.15"
    }
  }
}
In this code block, you're setting the required version of Terraform to 0.13.x and setting the New Relic provider to the latest 2.x version. Using the right version constraints for your setup will provide better stability with your Terraform runs.
Now that you've set your Terraform and New Relic provider versions, you need to configure the New Relic provider.
»Configure the New Relic Provider
With terraform all set, configure the New Relic provider with the following items:
Your New Relic Account ID.
Your New Relic User API key. Most User API keys begin with the prefix
NRAK-.Your New Relic region. Your region is
USif your account settings page is located atone.newrelic.com, andEUif your account is located atone.eu.newrelic.com.
We recommend configuring the New Relic provider using environment variables to help keep sensitive credential information out of your codebase. This also allows for setting your environment variables in your Terraform Cloud workspace.
To get started using environment variables, you will want to set the following in your local environment:
export NEW_RELIC_ACCOUNT_ID=12345
export NEW_RELIC_API_KEY="NRAK-***"
export NEW_RELIC_REGION="US"
It’s important to note that you will also be adding these environment variables to your Terraform Cloud workspace that you will be set up later in this guide.
Since you are using environment variables to configure the New Relic provider, your provider block in your main.tf file can be left empty.
# If using environment variables, your provider block can be empty
provider "newrelic" {}
By setting these values on the New Relic provider, you're configuring the provider to make changes on behalf of your account through New Relic APIs.
For more information about configuring the New Relic provider, please feel free to check out our official provider documentation.
At this point, it’s a good idea to commit and push your code to your repository before you move on to wiring up your repository in Terraform Cloud.
git commit -m "initial commit for New Relic Terraform provider"
git push
»Create a Terraform Cloud Workspace
With your GitHub repository updated with your Terraform configuration code, it’s time to integrate Terraform Cloud into the workflow. Terraform Cloud Workspaces offer a way to organize your infrastructure. You can think of a Terraform Cloud Workspace as a working directory for a collection of infrastructure configurations.
We recommend following Terraform Cloud’s getting started guide to get up and running with a new workspace. The guide provides an example repository to link to the workspace, however, you will want to use the GitHub repository you created earlier.
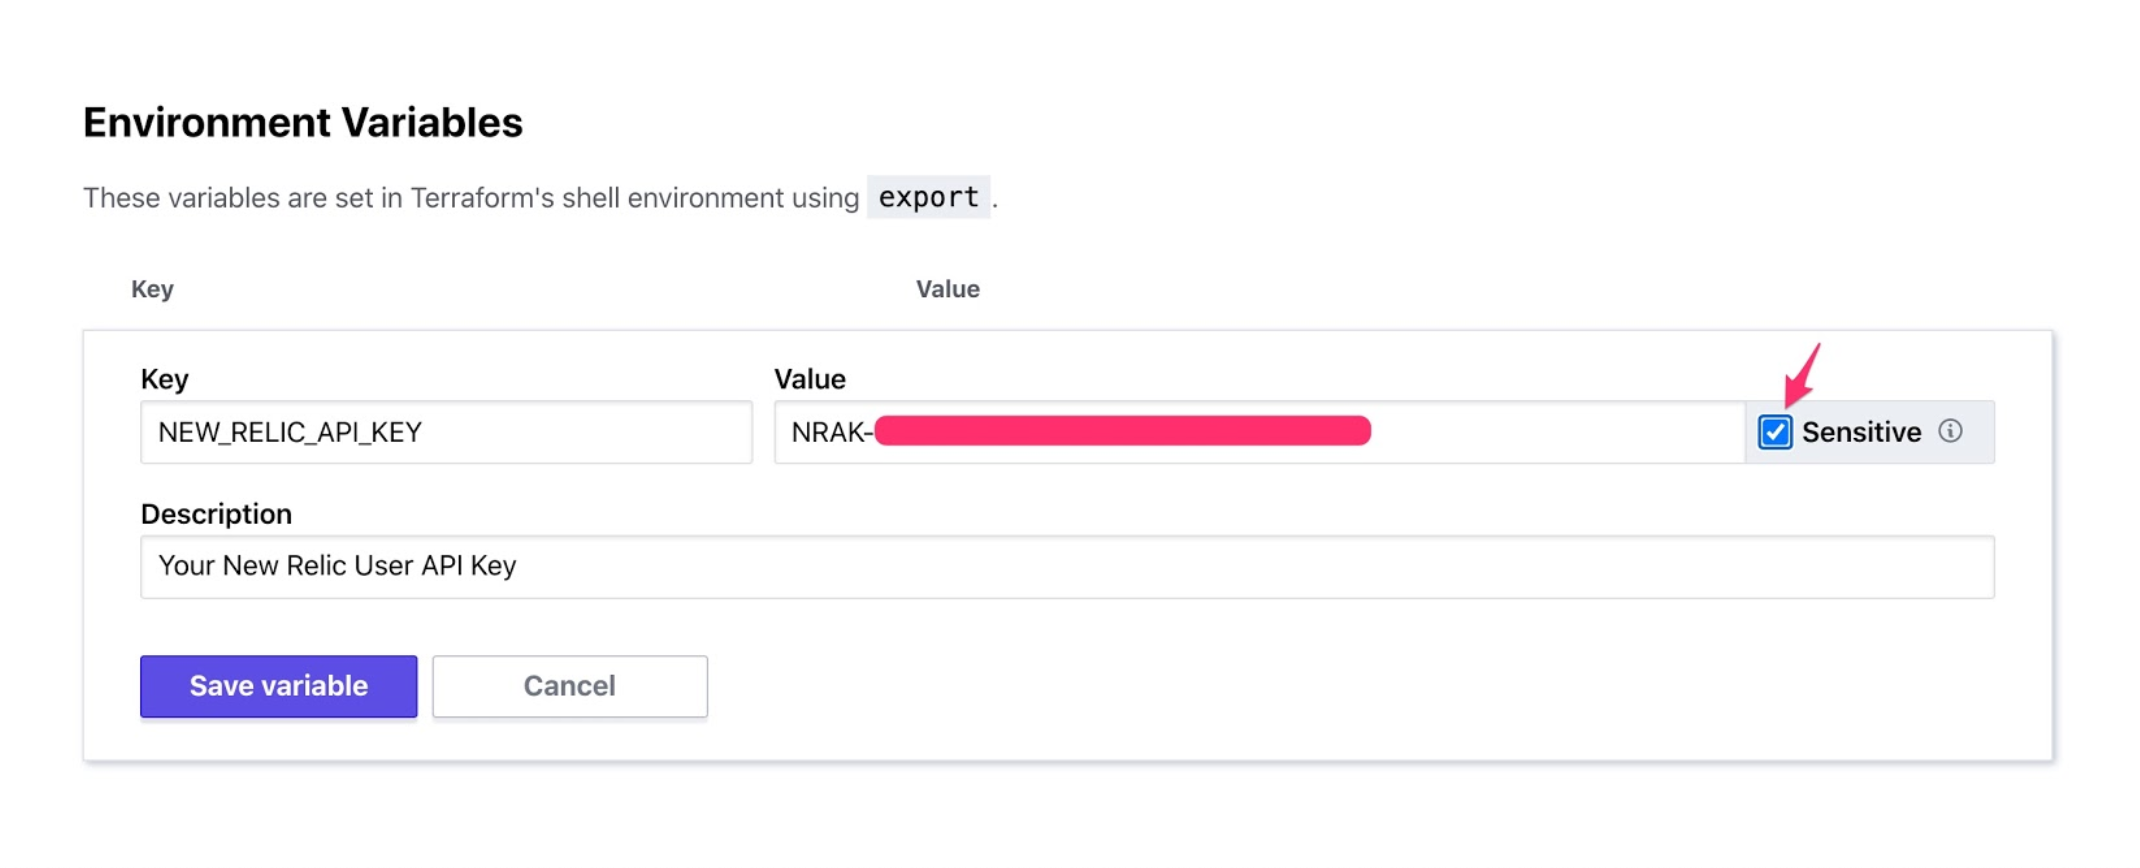
As part of the process, make sure to configure the environment variables mentioned earlier to the workspace.
Add each of your associated New Relic environment variables using the screenshot below as an example. For sensitive credentials, we recommend checking the “sensitive” checkbox.
After you’ve created your workspace and linked it to your repository, you can start to build out the rest of your New Relic Terraform configuration. As you build out each new resource, you can push up your changes to your repository and then use Terraform Cloud to execute your plan to provision your resources. You can even set up your workspace to automatically pick up your changes and apply your Terraform plan as you push updates.
You may also want to adjust some additional workspace options, such as “auto apply,” which will automatically apply your Terraform plan when you push up changes to your main branch. These settings can be found under Settings > General.
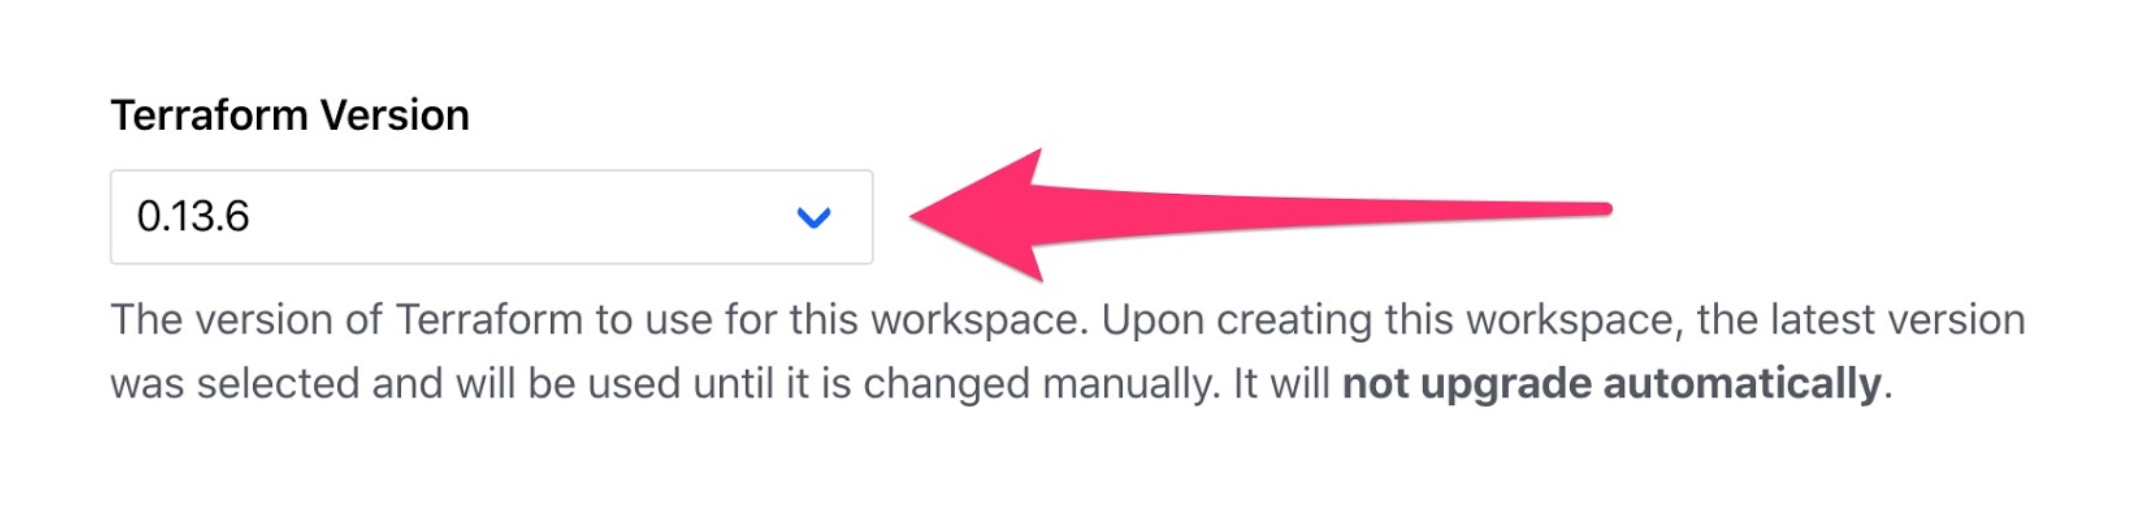
Lastly, you’ll want to make sure your workspace is configured to use the same version of Terraform as you configured in your main.tf file. The Terraform version specified in your main.tf file was Terraform version 0.13.x, so you will want to set your workspace’s Terraform version to the latest 0.13.x, which at the time of writing is 0.13.6.
»Create a New Relic Alert Policy with the Golden Signal Alerts
Now that you have a Terraform Cloud workspace and your New Relic provider is configured, initialize Terraform:
terraform initWhen Terraform finishes installing and registering the New Relic provider, you'll receive a success message and some actionable next steps, such as running terraform plan. But thanks to Terraform Cloud, manually running Terraform commands is unnecessary other than to potentially test your configuration with a dry run.
With the New Relic provider configured and successfully initialized, you can define an alerting strategy for your application.
Since you're targeting a specific application, use a newrelic_entity to fetch the application information from New Relic and allow us to reference that data elsewhere in the configuration:
data "newrelic_entity" "example_app" {
  name = "Your App Name" # Must be an exact match to your application name in New Relic
  domain = "APM" # or BROWSER, INFRA, MOBILE, SYNTH, depending on your entity's domain
  type = "APPLICATION"
}
Next, create a newrelic_alert_policy. Give the policy a dynamic name based on your application's name. This helps specify the scope of the policy:
resource "newrelic_alert_policy" "golden_signal_policy" {
  name = "Golden Signals - ${data.newrelic_entity.example_app.name}"
}
At this point, you should be able to test your configuration with a dry run:
terraform planYou will see some output that displays Terraform's execution plan if you were to run terraform apply yourself, but we’re only running this manually to ensure things are set up properly.
[output] {muted}# Example output
[output] ------------------------------------------------------------------------
[output]
[output] An execution plan has been generated and is shown below.
[output] Resource actions are indicated with the following symbols:
[output]   + create
[output]
[output] Terraform will perform the following actions:
[output]
[output]   # newrelic_alert_policy.golden_signal_policy will be created
[output]   + resource "newrelic_alert_policy" "golden_signal_policy" {
[output]       + account_id          = (known after apply)
[output]       + id                  = (known after apply)
[output]       + incident_preference = "PER_POLICY"
[output]       + name                = "Golden Signals - Your App Name"
[output]     }
[output]
[output] Plan: 1 to add, 0 to change, 0 to destroy.
[output]
[output] ------------------------------------------------------------------------
In this case, the plan shows you that Terraform will create a new alert policy when you run terraform apply, but we’re going to let Terraform Cloud handle that for us.
Instead of running terraform apply, commit your code changes and push to your repository.
git add main.tf
git commit -m "added New Relic entity data source and alert policy resource"
git push
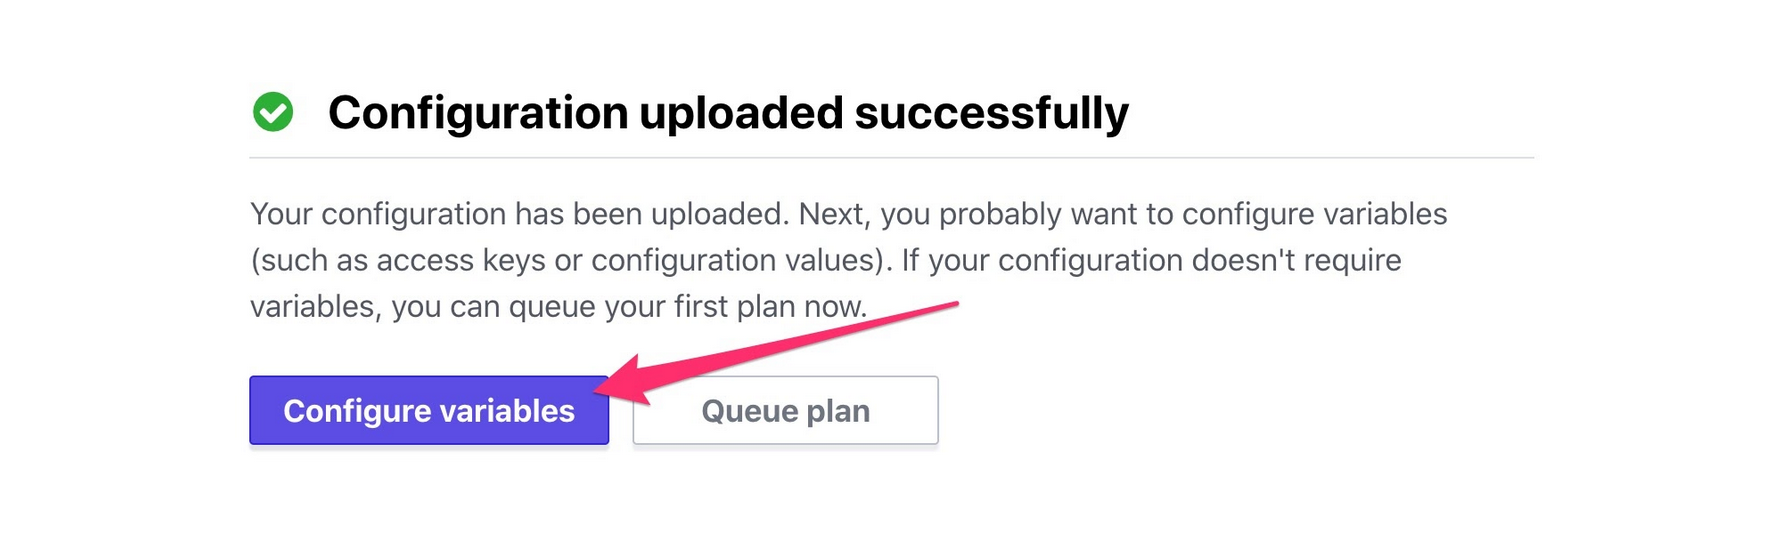
With your updates pushed up, queue a Terraform run in your workspace:
You will see similar terraform plan output, but this time it will be within the Terraform Cloud UI. If you have the “auto apply” settings turned on, a successful Terraform plan will result in your plan getting automatically applied, otherwise you will need to use the UI to apply the plan.
Once you’ve applied your Terraform plan, log in to New Relic and navigate to Alert Policies to confirm that Terraform created your new policy.
As you move through the next steps of creating alert conditions, you can commit and push your changes and then use Terraform Cloud to execute your Terraform plan and apply the updates. After each update, refresh your alert policy webpage to see the new alert conditions added to your policy.
»Provision Alert Conditions Based on the Four Golden Signals
Next, add alert conditions for your application based on the four golden signals: latency, traffic, errors, and saturation. Apply these alert conditions to the alert policy you created in the previous step.
»Latency
Most folks want to avoid slow response times. You can create a newrelic_alert_condition that triggers if the overall response time of your application rises above five seconds for five minutes:
# Response time
resource "newrelic_alert_condition" "response_time_web" {
  policy_id       = newrelic_alert_policy.golden_signal_policy.id
  name            = "High Response Time (Web) - ${data.newrelic_entity.example_app.name}"
  type            = "apm_app_metric"
  entities        = [data.newrelic_entity.example_app.application_id]
  metric          = "response_time_web"
  runbook_url     = "https://www.example.com"
  condition_scope = "application"

  term {
    duration      = 5
    operator      = "above"
    priority      = "critical"
    threshold     = "5"
    time_function = "all"
  }
}
Note that you're linking this alert condition to the previously configured alert policy with policy_id.
»Traffic
Traffic represents how much demand is placed on your system at any given moment. Throughput is a metric that measures how much traffic goes to your application. Create a newrelic_alert_condition that triggers if the overall response rate of your application falls below five requests per minute for five minutes:
# Low throughput
resource "newrelic_alert_condition" "throughput_web" {
  policy_id       = newrelic_alert_policy.golden_signal_policy.id
  name            = "Low Throughput (Web)"
  type            = "apm_app_metric"
  entities        = [data.newrelic_entity.example_app.application_id]
  metric          = "throughput_web"
  condition_scope = "application"

  # Define a critical alert threshold that will
  # trigger after 5 minutes below 5 requests per minute.
  term {
    priority      = "critical"
    duration      = 5
    operator      = "below"
    threshold     = "5"
    time_function = "all"
  }
}
This type of alert is useful when you expect a constant baseline of traffic throughout the day — a drop off in traffic can indicate a problem.
»Errors
If your application's error rate spikes, you need to know about it. Create a newrelic_alert_condition that triggers if your application's error rate rises above 5% for five minutes:
# Error percentage
resource "newrelic_alert_condition" "error_percentage" {
  policy_id       = newrelic_alert_policy.golden_signal_policy.id
  name            = "High Error Percentage"
  type            = "apm_app_metric"
  entities        = [data.newrelic_entity.example_app.application_id]
  metric          = "error_percentage"
  runbook_url     = "https://www.example.com"
  condition_scope = "application"

  # Define a critical alert threshold that will trigger after 5 minutes above a 5% error rate.
  term {
    duration      = 5
    operator      = "above"
    threshold     = "5"
    time_function = "all"
  }
}
»Saturation
Saturation represents how "full" your service is and can take many forms, such as CPU time, memory allocation, or queue depth. In this example, assume you already have a New Relic Infrastructure agent installed on the hosts serving your application, and you want to configure an alert for when CPU utilization spikes above a certain threshold:
# High CPU usage
resource "newrelic_infra_alert_condition" "high_cpu" {
  policy_id   = newrelic_alert_policy.golden_signal_policy.id
  name        = "High CPU usage"
  type        = "infra_metric"
  event       = "SystemSample"
  select      = "cpuPercent"
  comparison  = "above"
  runbook_url = "https://www.example.com"
  where       = "(`applicationId` = '${data.newrelic_entity.example_app.application_id}')"

  # Define a critical alert threshold that will trigger after 5 minutes above 90% CPU utilization.
  critical {
    duration      = 5
    value         = 90
    time_function = "all"
  }
}
For the Infrastructure alert, you created a newrelic_infra_alert_condition that triggers if the aggregate CPU usage on these hosts rises above 90% for five minutes.
»Get Notified When an Alert Triggers
Now that you've configured some important alert conditions, add a notification channel to your alert policy to ensure the proper folks get notified when an alert triggers. To do so, use a newrelic_alert_channel.
To begin, create an email notification channel to send alert notifications to your email. Use this when you want to notify a specific person or team when alerts are triggered:
resource "newrelic_alert_channel" "team_email" {
  name = "example"
  type = "email"

  config {
    recipients              = "yourawesometeam@example.com"
    include_json_attachment = "1"
  }
}
If you want to specify multiple recipients, use a comma-delimited list of emails.
Last, but not least, in order to apply the notification channel to your alert policy, create a newrelic_alert_policy_channel.
newrelic_alert_policy_channel:
resource "newrelic_alert_policy_channel" "golden_signals" {
  policy_id   = newrelic_alert_policy.golden_signal_policy.id
  channel_ids = [newrelic_alert_channel.team_email.id]
}
A newrelic_alert_policy_channel links the notification channel you just created to your alert policy.
To finalize your golden signal alerts configuration, commit and push up your changes, then queue your plan again one last time from Terraform Cloud to make sure everything is up to date.
new_relic_alert_channel supports several types of notification channels, including: email, slack, and pagerduty. So, if you want to explore this more, try creating an alert channel for a second channel type, such as Slack:
# Slack notification channel
resource "newrelic_alert_channel" "slack_notification" {
  name = "slack-example"
  type = "slack"

  config {
    # Use the URL provided in your New Relic Slack integration
    url     = "https://hooks.slack.com/services/XXXXXXX/XXXXXXX/XXXXXXXXXX"
    channel = "your-slack-channel-for-alerts"
  }
}
Before you apply this change, you need to add the New Relic Slack App to your Slack account and select a Slack channel to send the notification. With this new alert channel, triggered alerts send notifications to the Slack channel of your choice.
»Conclusion
As your team evaluates the alerting system you’ve put in place, you’ll find that you may need to tweak configuration values, such as the alert threshold and duration. If you manage your Terraform project in a remote repository, you can submit a pull request so your team can review these changes alongside the rest of your code contributions.
In addition to maintaining your infrastructure code with a version control system, Terraform Cloud provides a safe and secure way to deploy your infrastructure changes. It also provides a great mechanism for managing your organization’s teams.
For more information regarding various approaches to building a CI/CD pipeline with GitHub and Terraform Cloud, HashiCorp offers a practitioner's guide to help you figure out which approach would work best for your organization and a recommended practices guide to learn more about their recommended workflow and how to evolve your provisioning practices.
Congratulations! You're officially practicing observability as code. Ready for more advanced New Relic guides and tutorials? Visit the New Relic developer site.