HashiCorp Consul relies on a subsystem called Serf that uses a gossip protocol to manage membership and broadcast messages to the cluster. The protocol, membership management, and message broadcasting are provided through the Serf library. The gossip protocol used by Serf is based on a modified version of the SWIM (Scalable Weakly-consistent Infection-style Process Group Membership) protocol. While many users have successfully run this system at a large scale, the specific details of how this component performs at different levels of scale are nuanced, and we often get questions about this topic.
To answer some of these questions, HashiCorp ran a scale test to observe gossip stability risk failure for Consul deployments with more than 50,000 clients, which is the real-time Consul cluster deployment for the largest Consul Enterprise customer. This customer uses Consul as the core service discovery and service mesh deployment for its business applications and its requirements do not allow for any downtime.
This scale-test report will briefly cover some background on the purpose of network segments and why we recommend applying them. Then it will go over the scale-testing results for three different configuration scenarios, showing how Consul responds when using network segments in each case. It will conclude with an appendix of useful side-notes about the tests.
Note: Consul deployed on Kubernetes using Consul 1.14 or higher now uses a new simplified architecture called Consul Dataplane, which replaces the Consul client agent with a lightweight component to configure Envoy proxies. Without client agents, Consul Kubernetes deployments 1.14 or higher no longer use gossip or local service registration. Therefore this blog does not apply to Consul 1.14+ on Kubernetes.
»Understanding Gossip in Consul
Consul uses an eventually consistent gossip-based membership protocol and failure detector comprising two layers: Serf and memberlist.
»Memberlist
Memberlist implements the SWIM gossip protocol that provides basic membership and failure detection. It also provides a mechanism to broadcast custom messages to members that higher layers (Serf and Consul) use to build upon memberlist’s capabilities.
»Serf
Serf is built on top of the memberlist and is responsible for maintaining a list of known Consul agents in the cluster and their state (alive, failed, and left). Serf extends the memberlist protocol with Intent messages — join and leave — indicating when Consul agents intend to join the cluster or terminate gracefully. It also takes care of snapshotting the member state to disk so restarting nodes can rejoin without needing to re-bootstrap their entire knowledge of the cluster again. Serf also propagates Serf tags throughout the cluster that indicate the presence or absence of features and the version of each member (Consul agent).
In clusters with a lot of join/leave activity, the Serf intent queue may grow because messages are generated faster than they can be propagated. If that growth continues indefinitely it can threaten the stability of the cluster. The Serf intent queue depth can be monitored with the consul.serf.queue.Intent metric.
»Why Use Network Segments?
Consul network segments, introduced in Consul 0.9.3, are designed to segment gossip traffic between Consul client agents in a Consul datacenter. Customers use this feature in production to address two different challenges:
Operating one Consul datacenter in a segmented network, where full gossip connectivity between all Consul client agents is not possible
Mitigating gossip stability risk due to a high rate of agent churn, which can occur in a single Consul datacenter with more than 5K nodes
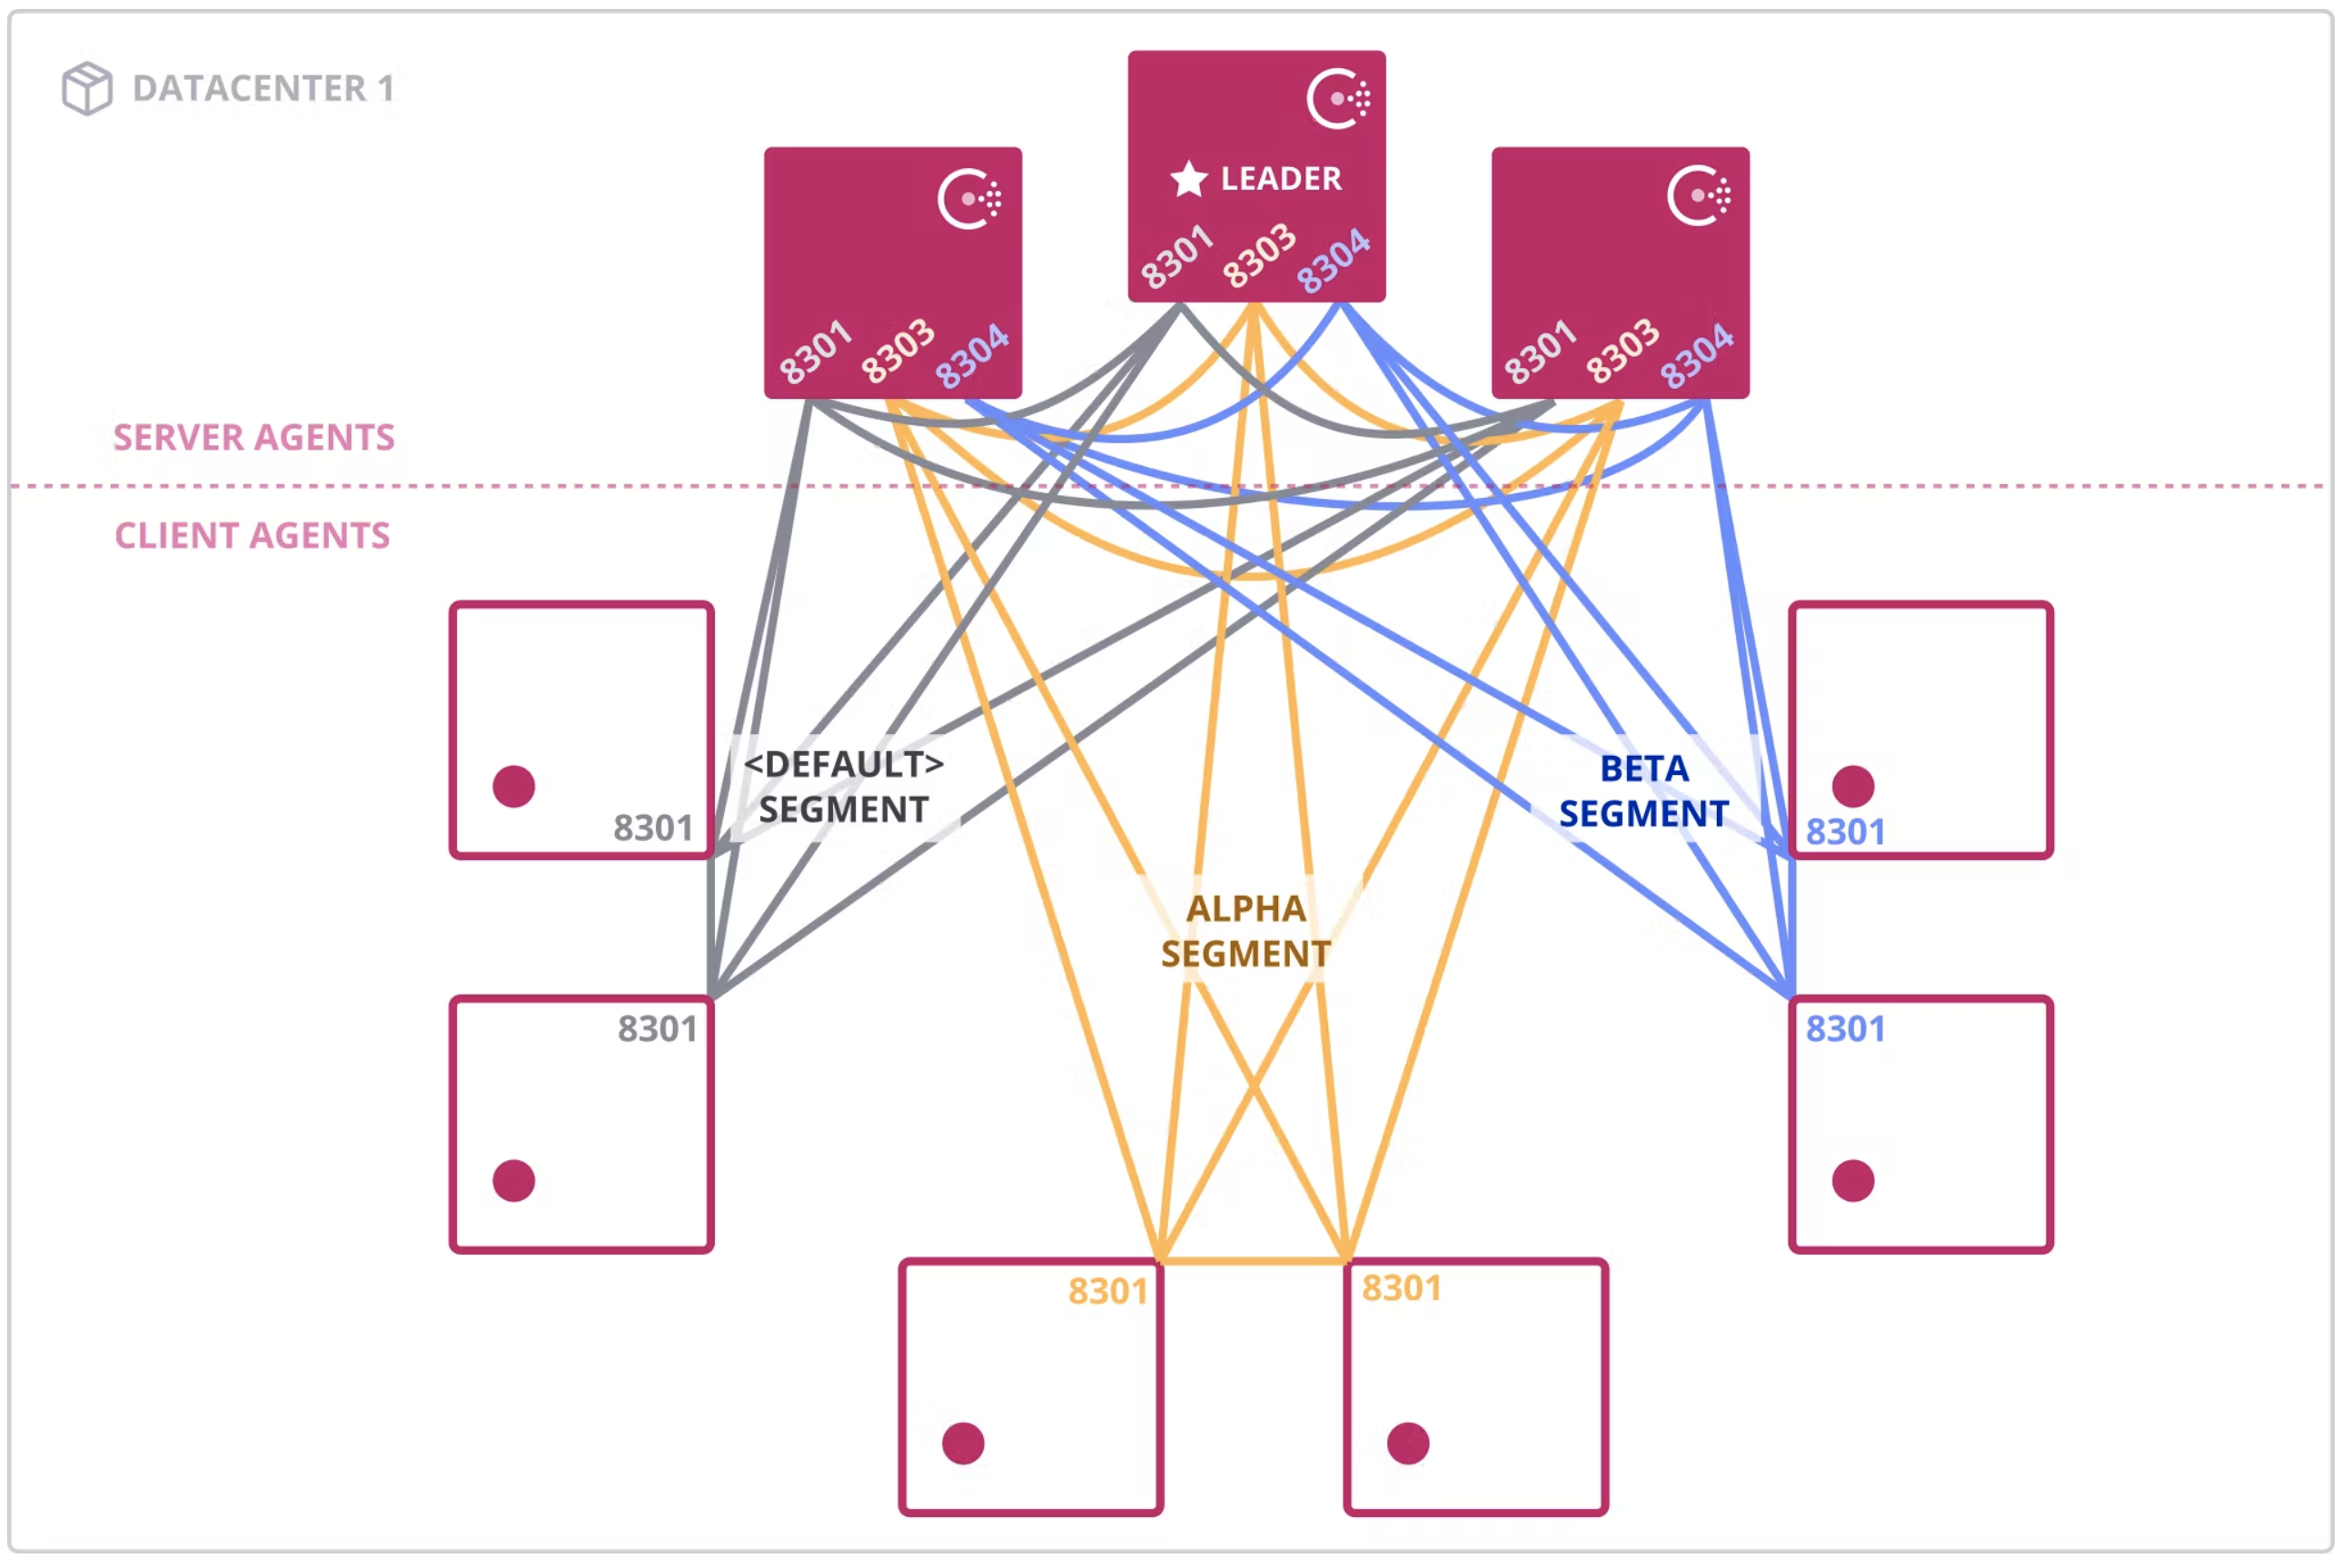
This diagram shows how a network may be segmented.
»Testing Parameters
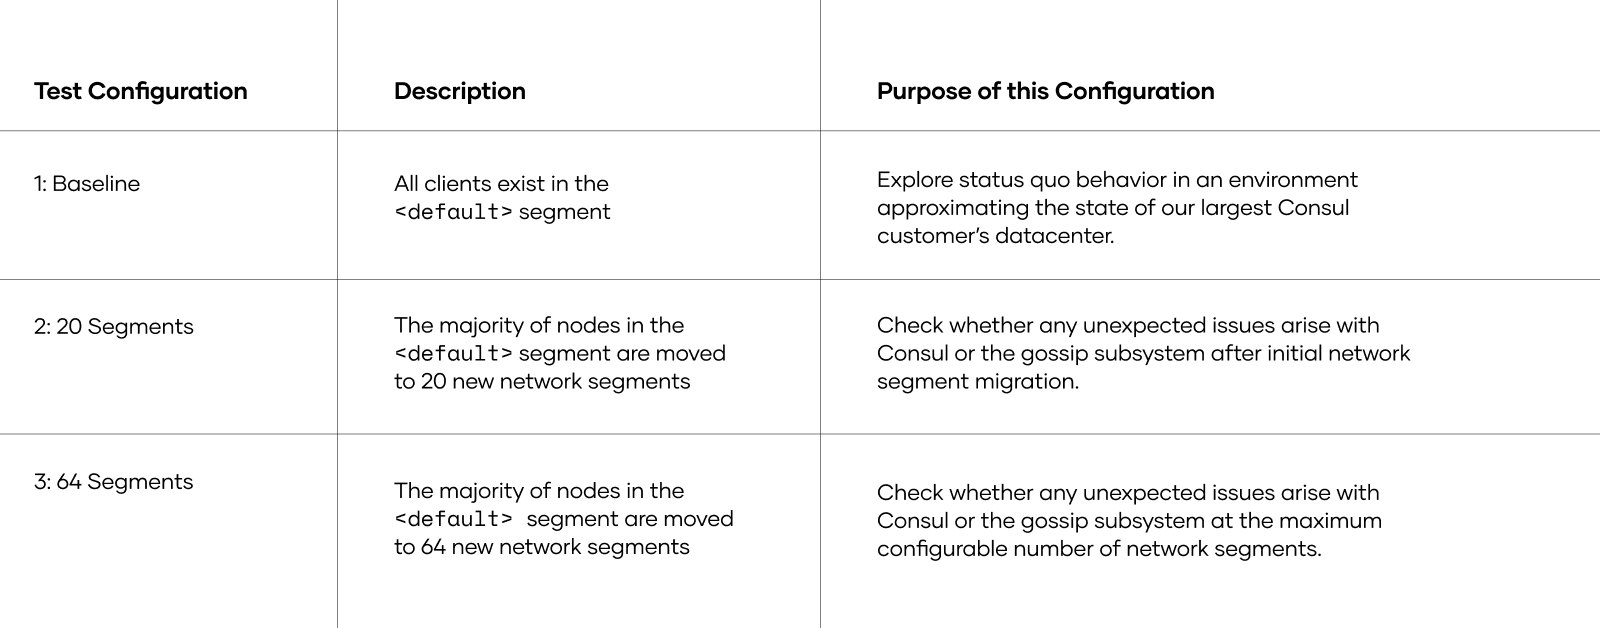
To inform the gossip stability risk mitigation recommendations in this post, HashiCorp conducted migration tests to network segments under baseline conditions that approximate our largest Consul Enterprise customer values for relevant metrics. We tested network segments with more than 60K client nodes under 3 test configurations:
This test was designed to identify potential performance bottlenecks with server health and gossip behavior when applying network segments at scale. It has three goals:
Validate server agent health in the 20- and 64-segment configurations under various load levels and migration plans.
Validate Serf and memberlist performance in the 20- and 64-segment configurations.
Identify the metrics to efficiently monitor the migration of clients to the network segments.
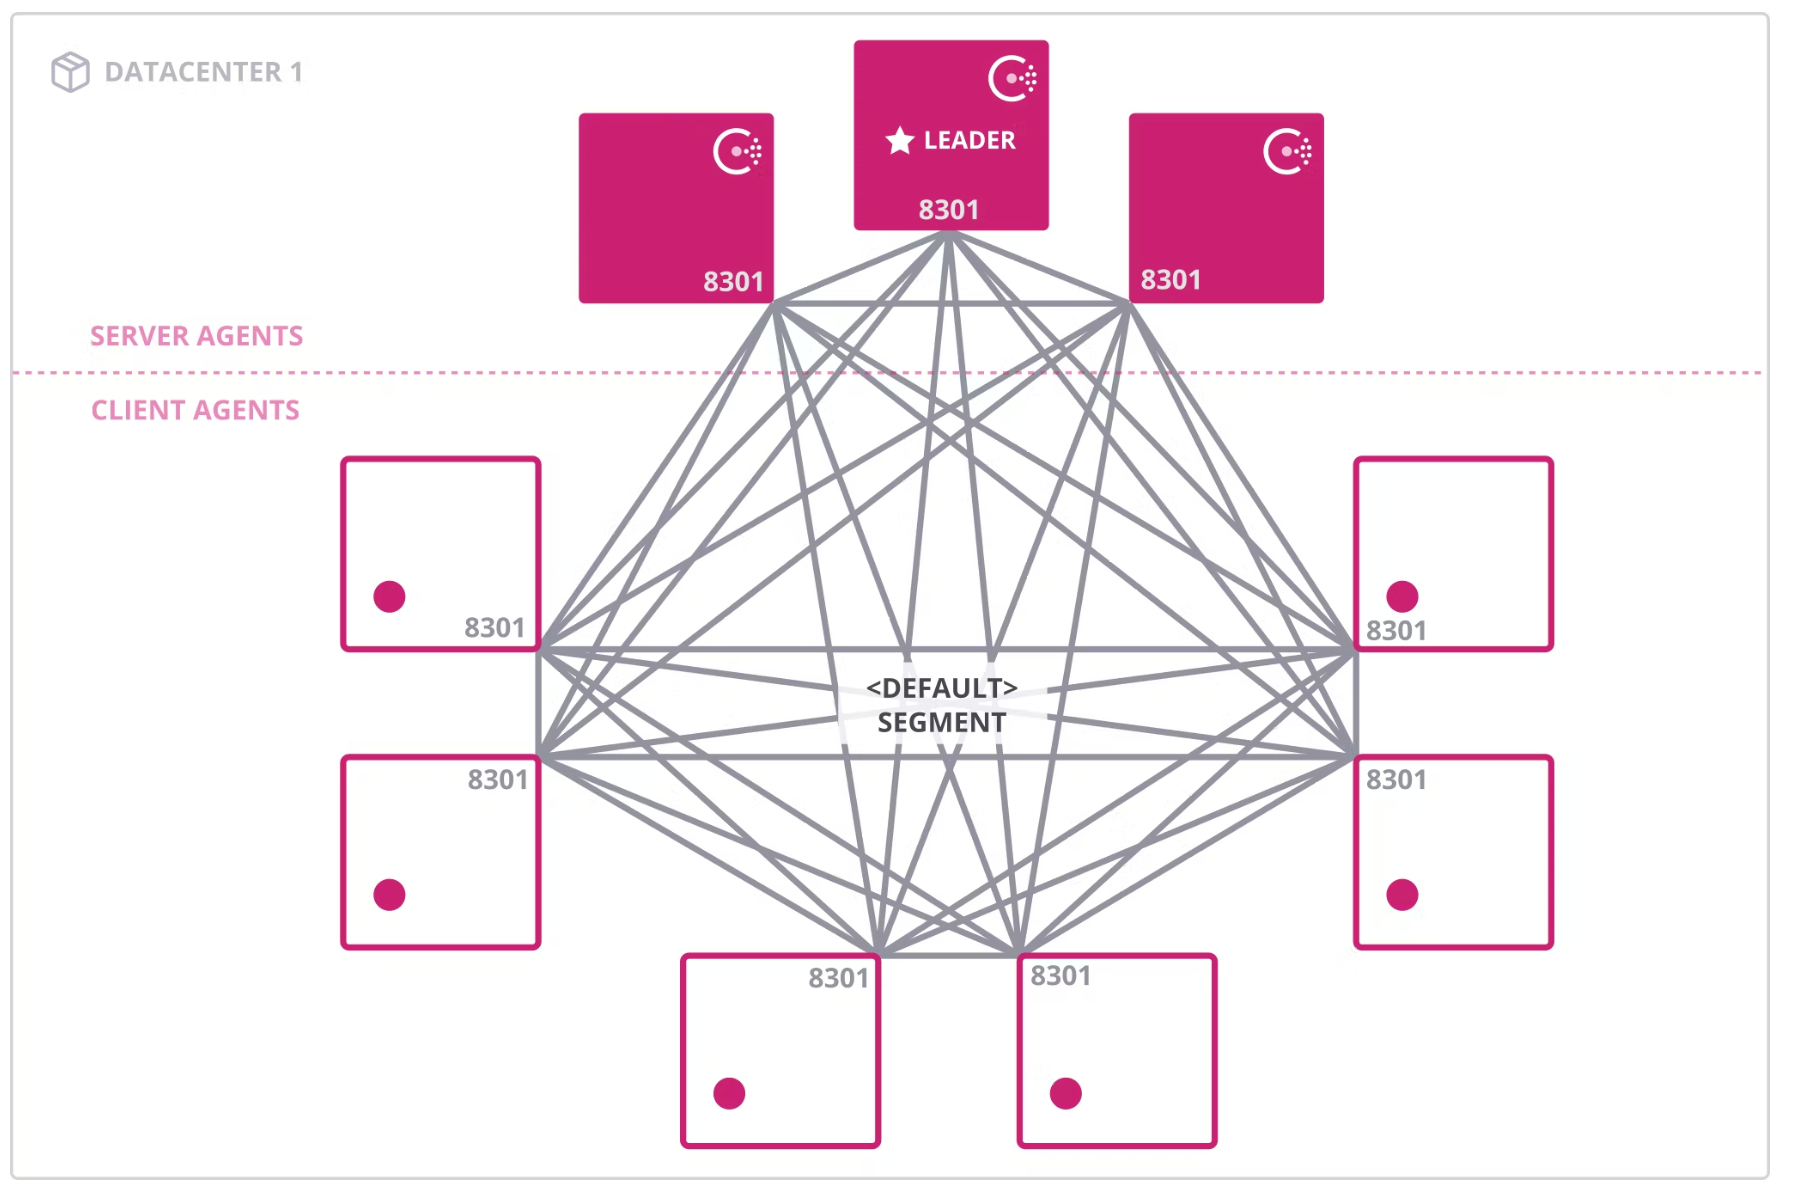
This diagram shows the <default> network segment
»Test Cluster Specification (Consul Servers and Clients)
This section describes the setup of a single Consul datacenter in Amazon EC2 with 5 server agents and more than 66K agents.
Instance sizes were intentionally overspecified to avoid resource limitations becoming bottlenecks during the test. This isolates the behavior of Consul.
»Consul Server Nodes
5 servers, all voters
c6id.32xlarge
vCPU: 128
Memory: 256GB RAM
Network bandwidth: 50 GB/s
Instance storage: 4x1,900 GB NVMe SSD with EBS bandwidth 40GB/s
»Consul Client Nodes
Baseline configuration
6,000 EC2 servers, 2 autoscaling groups (ASGs) (3,000/ASG)
11 clients per EC2 instance — Total count of 66,000 clients in
<default>segmentc5.2xlarge
vCPU: 8
Memory: 16 GB RAM
Network bandwidth: Up to 10 GB/s
Instance storage: 25 GB gp2 up to 4,750 Mbps
20-segment configuration
2,000 EC2 servers, 2 ASGs — Default (1,000/ASG)
5,000 EC2 servers in 20 ASG — 20 segments (250 EC2 instances per ASG per segment)
Total clients in segments 55,000 — Running 2,750 clients per segment
64-segment configuration
2,000 EC2 servers, 2 ASGs — Default (1,000/ASG)
5,000 EC2 servers in 64 ASG — 64 segments (100 EC2 instances per ASG per segment)
Total clients in segments 55,000 — Running 1,100 clients per segment
»Joining Nodes to the Consul Datacenter
The Consul servers were started first and allowed to join the cluster using cloud auto-join with specific server tags so that they would start out in a healthy state.
To quickly stand up a large cluster while maintaining stability, Consul clients are organized in a star schema/hub-and-spoke topology. Each EC2 instance runs multiple Consul client agents, one of which is the base client. The base client uses cloud auto-join to join the cluster. All other Consul clients on the same EC2 instance join with the base client instead of using cloud-auto join.
The Consul agent targeted by a join operation syncs Serf/memberlist data with the joining agent, placing a load on the targeted agent. Having most Consul clients join with another base client agent, rather than join a server agent via cloud auto-join, distributes the load of handling a high rate of joins while standing up the cluster. This join-topology is necessary only because we were standing up a large cluster quickly, rather than working with an existing one.
Base clients join with:
retry_join = ["provider=aws region=us-west-2 tag_key=consul-cns1 tag_value=consul-cns1"]
Star clients join to base clients with:
retry_join = ["localhost:8301"]
We arranged the test into three major test configurations and load levels. Each test configuration was running on the retry_join configurations listed above.
»Test Configurations
Note: All of the test configurations listed below were maintained as HashiCorp Terraform infrastructure configurations to ensure consistent test configuration. As an exception, adding non-default segments to Consul server agents was performed by manually adding the segment stanza to the agent configuration file to avoid the extra delay in destroying and recreating the server virtual machines.
»Baseline Configuration
Consul server agents are running only on the
<default>segment.The 66K clients run on the
<default>segment with 2 different ASGs. This is because AWS accounts have quotas on the number of instances in a single ASG.Both ASGs are configured with dynamic scaling policies and scheduled actions to create node churn.
»20-Segment Configuration
66K client agents started in the
<default>segment.Then we added 4,400 new client agents across 20 segments.
Then we transitioned to a state with 22K client agents in the
<default>segment and 55K client agents across 20 segments. Client agent churn was ~220 clients/minute.
The 20-segment test configuration was enabled manually by individually recycling the server agents.
20 ASGs were created to deploy client nodes to join their respective segments spread across 5 servers in 4 availability zones (AZs) in us-west-2 (AWS).
Individual ASGs were initiated with a desired capacity of 20 EC2 instances, i.e. 240 clients each.
Base segment client:
segment = "cns1-segment-${segment_number}"
  ports {
     serf_lan = $(( 8302+${segment_number} ))
   }
  retry_join = ["provider=aws region=us-west-2 tag_key=consul-cns1 tag_value=consul-cns1"]
Star segment clients:
segment = "cns1-segment-${segment_number}"
   ports {
     http = $((8566+$c))
     dns = $((8666+$c))
     serf_lan = $((8367+$c))
   }
   retry_join = ["localhost:$(( 8302+${segment_number} ))"]
»64-Segment Configuration
22K nodes started in the
<default>segment and 55K nodes across 20 segments. Then, the 55K nodes in 20 segments were redistributed to 64 segments.The 64-segment test configuration was enabled manually by individually recycling the server agents.
64 ASGs were created to deploy client nodes to join their respective segments spread across 5 servers in 4 AZs in us-west-2 (AWS).
Individual ASGs were initiated with a desired capacity of 20 EC2 instances, i.e. 240 clients each.
»Allow Cluster to Reach a Steady State
After each configuration test phase of adding or removing Consul clients, the system was left idle and slowly reached a state of gossip convergence as observed in various metrics.
»Test Monitoring
We analyzed the test outcomes and the Consul dashboard to review the current state of gossip activity and overall gossip risk of a LAN gossip pool. Our review focused on Serf, memberlist, and system metrics to better understand system performance under defined test-configuration and load levels.
»Assessing Gossip Convergence
We selected the gauge metric consul.consul.members.clients as the primary measure for gossip convergence since that metric is reliably reported by each Consul server by summing the alive Serf members from all connected segments. Convergence was defined as having each server report matching values of living nodes, and having that value match the expected node count at that phase of the test.
»Accounting for the Lack of Network Segment Labels on Serf and Memberlist Metrics
Unfortunately, the metrics emitted by the gossip subsystems named consul.serf.* and consul.memberlist.* were not individually labeled per segment in the consul_1.10.8+ent build that we tested with. That does not affect our findings because we relied on consul.consul.members.clients as an alternative, but it does affect the interpretation of graphs presented later in this post.
When network segments are enabled on a Consul server, the various segments (including the default segment) at the server agent will fight over the metric keyspace in a “last write wins” manner. Graphs detailing the inner workings of memberlist and Serf (such as consul.serf.queue.Intent) are ineligible for observation for the segmented portion of the testing duration. A future Consul version will provide labeled Serf and memberlist metrics to solve this problem.
When using the consul_1.10.8+ent version of Consul Enterprise (as we did in this test), the consul.serf.* and consul.memberlist.* metrics were ignored as soon as non-default network segments were in use.
To obtain additional insight into gossip subsystems (Serf, memberlist) once the network segments were in use — despite the lack of segment labels on consul.serf.* and consul.memberlist.* metrics. We observed several gossip-adjacent metrics or gossip-derived metrics instead. These proxy metrics were also observed during the un-segmented portion of the test along with the real gossip metrics to confirm they were aligned as reasonable proxies.
The gossip proxy metrics are described in more detail in Appendix A: Gossip Metrics Blackout Period.
»All Key Observed Metrics
The following metrics are inspected across all the test configurations:
»Gossip Proxy Metrics
These metrics are described in more detail in Appendix A: Gossip Metrics Blackout Period:
Consul.consul.members.clients(primary measure for gossip convergence)consul.consul.leader.reconcileconsul.catalog.registerconsul.fsm.coordinate.batch_update
»System Metrics
Avg: system.cpu.user(Server & Client Agents)Max: system.mem.used(Server & Client Agents)Sum: system.net.bytes_sentSum: system.net.bytes_receivedAvg: system.disk.write_time_pct(Server Agents)Max: system.disk.free(Server Agents)Max: system.disk.used(Server Agents)
»Consul Metrics
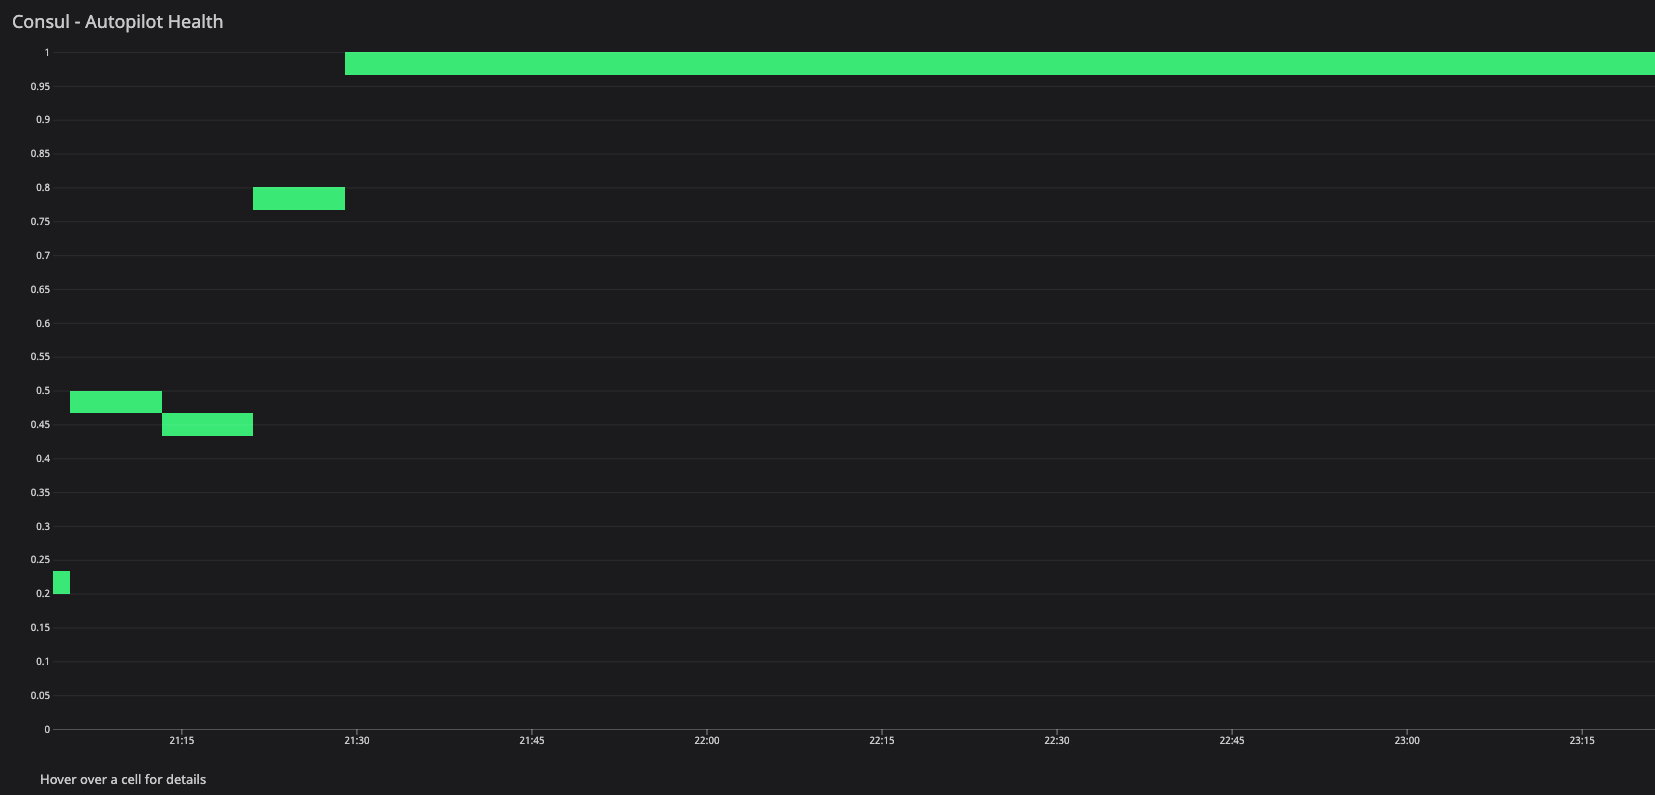
Sum (host): consul.serf.member.join(Server & Client Agents)consul.serf.eventsconsul.serf.msgs.sentconsul.serf.queue.Intentconsul.memberlist.gossip.avgconsul.memberlist.msg.suspectconsul.memberlist.msg.deadconsul.memberlist.probeNode.maxconsul.serf.member.joinconsul.serf.member.leftconsul.serf.member.aliveconsul.serf.member.failedconsul.serf.member.flap(Server Agents)consul.memberlist.pushPullNode.countconsul.memberlist.pushPullNode.max(Worst case)consul.autopilot.healthyconsul.consul.state.nodesconsul.consul.members.clientsOne graph showing the total count reported per server.
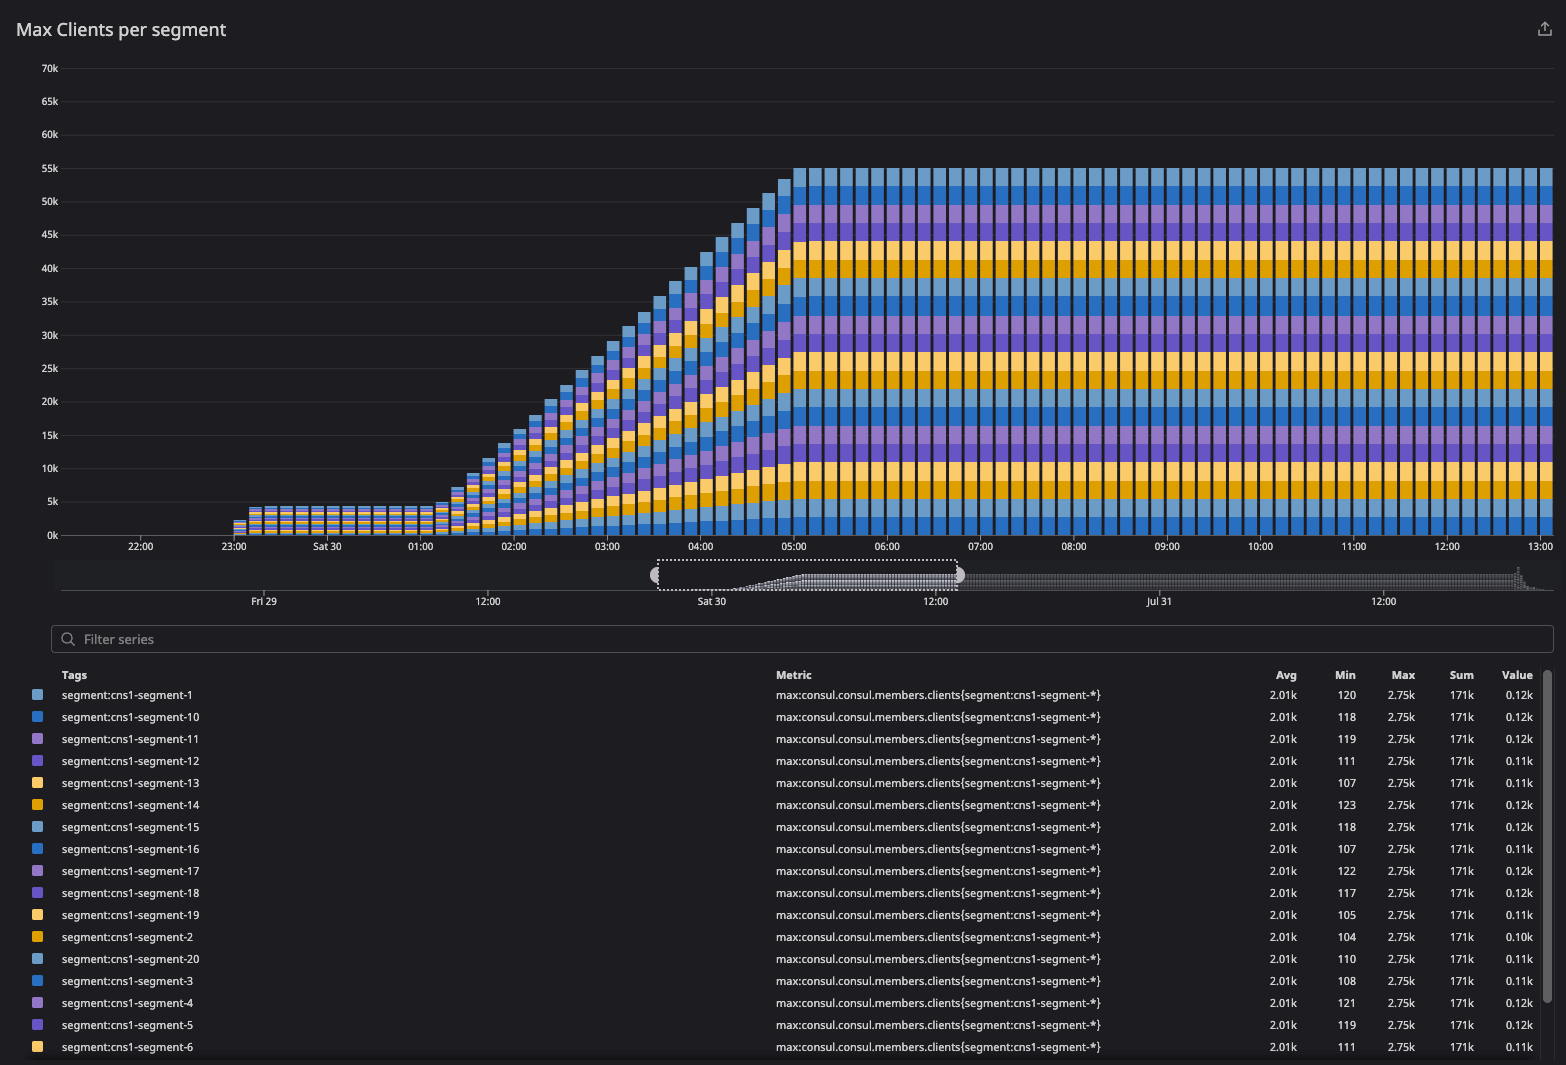
One graph showing the distribution of counts by segment tag.
consul.raft.commitTime.avgconsul.fsm.coordinate.batch_update.countconsul.fsm.coordinate.batch_update.maxconsul.consul.leader.reconcile.countconsul.consul.leader.reconcile.maxSum: consul.raft.commitTime.countAvg: consul.raft.commitTime.avgAvg: consul.raft.commitTime.95PercentileAvg: consul.runtime.gc_pause_ns.avg(Server Agents)Max: consul.consul.leader.reconcile.maxMax: consul.catalog.register.95 PercentileAvg: consul.catalog.register.avgSum: consul.raft.commitTime.count
»Test Plan Parameters
Consul network segment test parameters are aligned to the optimal migration path for large-scale Consul datacenters while maintaining cluster health. The test uses four different test configurations and measures various metrics:
Baseline: 66K clients on 1 gossip pool (segments not configured at all on servers)
20 Segments: 22K clients on
<default>segment and 55K equally spread among 20 segments (2,750 per non-default segment).64 Segments: 22K clients on
<default>segment and approximately 55K (869 per segment) equally spread among 64 segments.
»Test 1: Baseline Test Configuration
The baseline test environment metrics dashboard shows a summary of important gossip telemetry during the startup and convergence period for the baseline test environment.
These are the Consul system and cluster health metrics test dashboards we used to start the baseline test and resolve a network issue due to arp_cache.
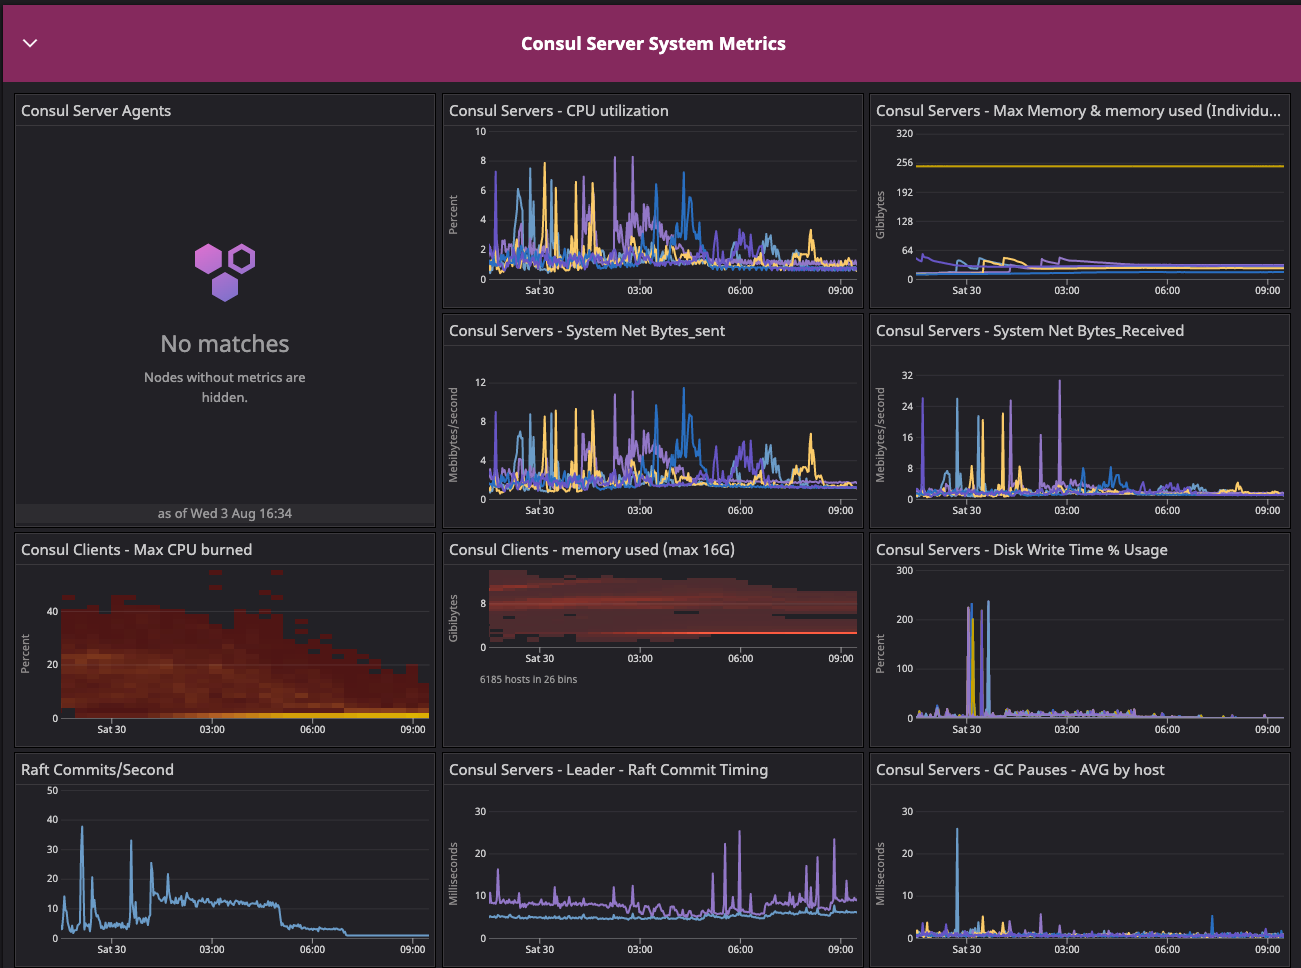
Consul system metrics dashboard for the baseline configuration test.
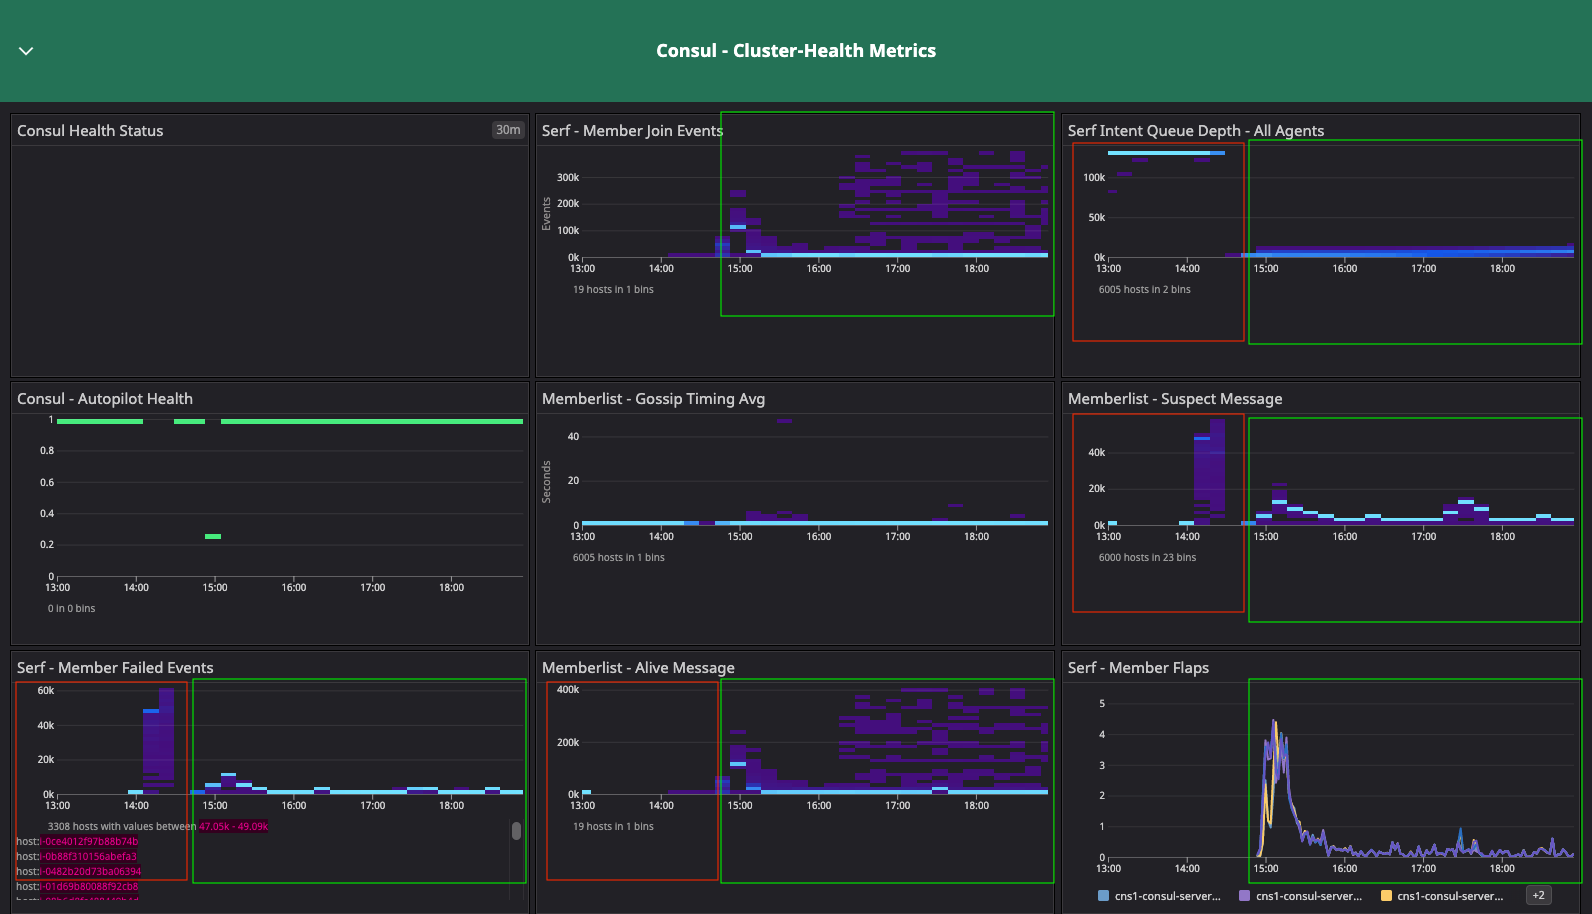

Consul cluster health metrics for the baseline configuration test.
We started capturing the metrics when cluster initialization was finished and all servers had attained the convergence point by showing the same number of client counts.
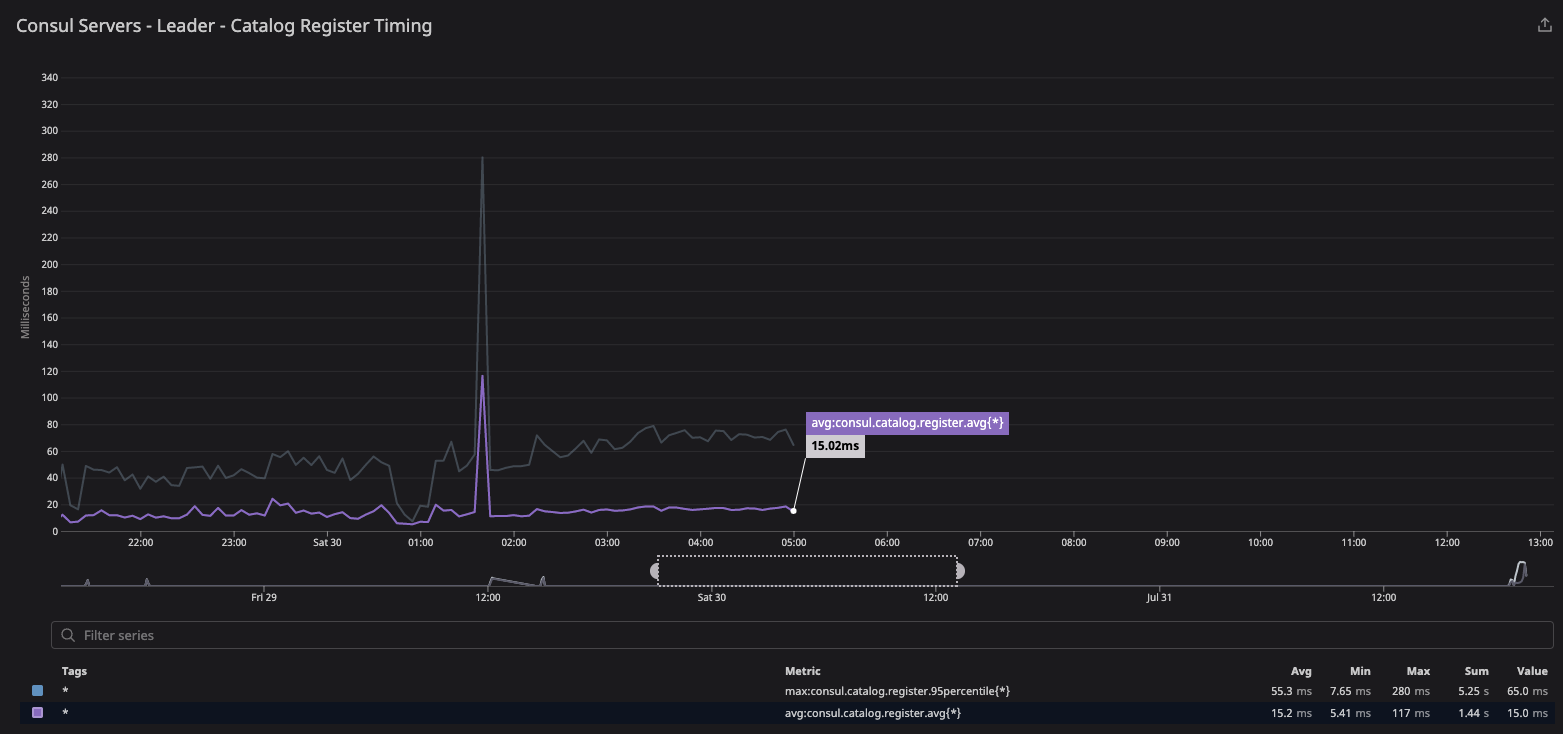
Results: In the two dashboards shown above, the area in the red box shows the state of cluster health before we resolved the network issue related to arp_cache, while the area in the green box shows the post-resolution phase, which demonstrates a significant difference in converging the consul.serf.queue.Intent metric.
The intent queue depth dropped from more than 130K to 13.3K as servers started processing network traffic. Overall, Consul's health was stable during the baseline test. This sudden increase in consul.serf.queue.Intent was related to the server recycling to resolve the arp_cache issue.
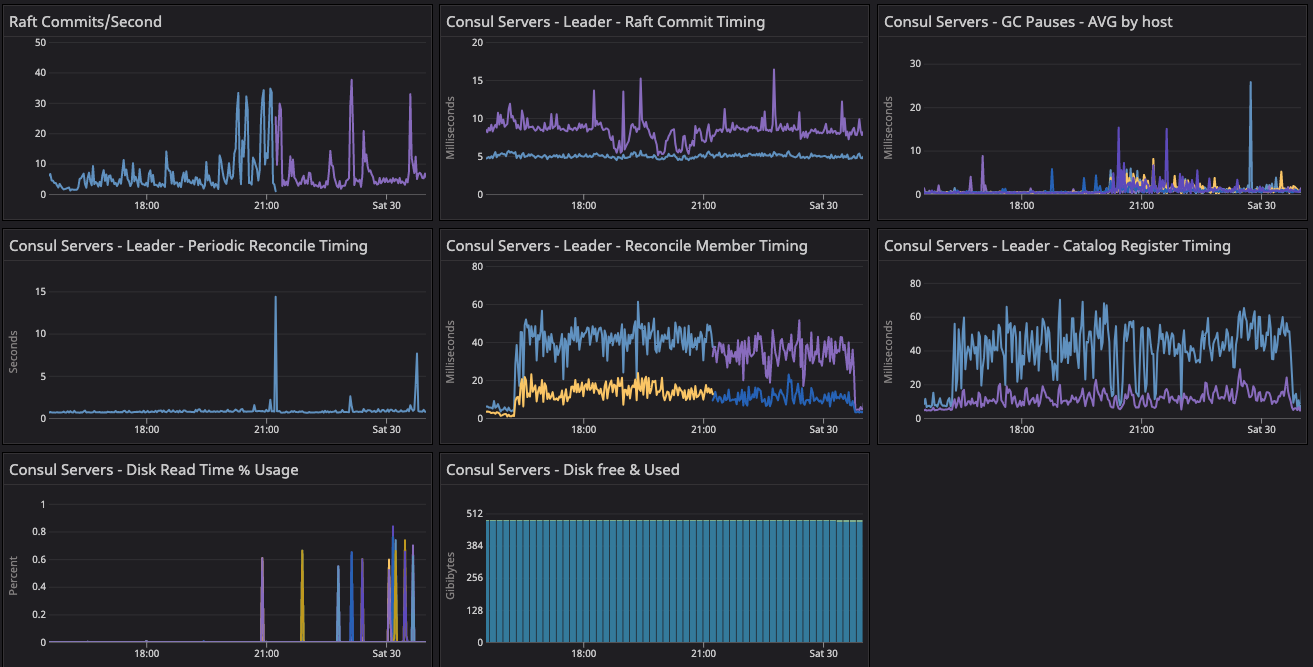
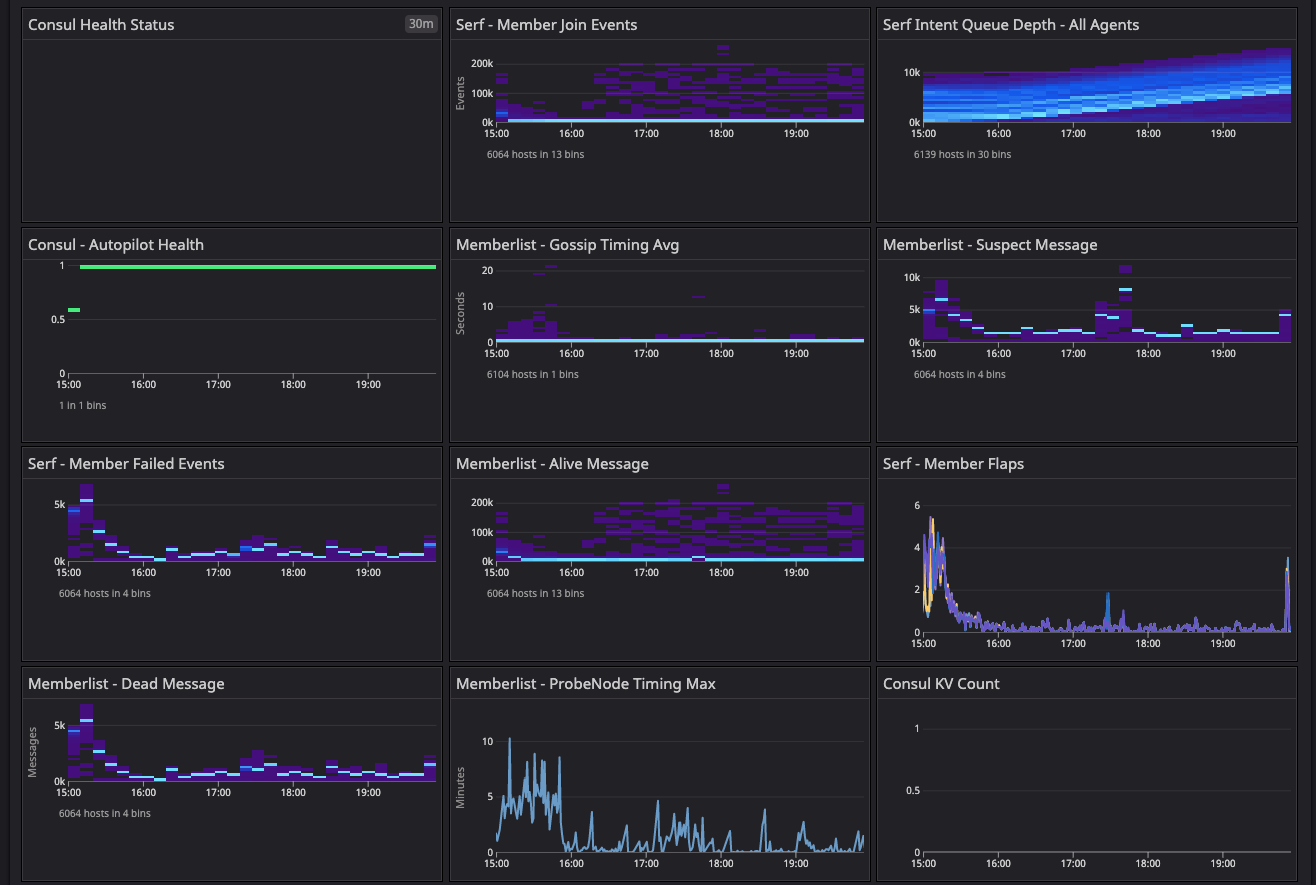
Observing node churn and load on the default fleet.
We enabled node churn at 11 clients/min, and the resulting constant load generated an 8-10% CPU spike every minute on the default segment fleets. This keeps driving the consul.serf.queue.intent metric. Fluctuation was observed in consul.memberlist and consul.member metrics during this timeframe until we restarted the server quorum with the 20-segment configuration.
»Test 2: 20-Segment Test Configuration
The 20-segment test configuration was enabled manually by recycling the individual server agents. We validated the required metrics and observed the Serf distribution on all the server agents along with doing random checks on the clients.
Metrics during the server recycling to update the 20-segment configuration and reset the gossip state.
At this point, we can observe high Serf flaps and Raft commits as we remove the server agent history in the Serf and Raft directories. The intent queue depth increased as well because cleaning the Serf and Raft directories destroyed the gossip and persistent state of the Raft. Unfortunately, during this period we cannot observe gossip as explained in Appendix D, which explains the lack of network segment labels on Serf and memberlist metrics.
The segment fleet and migration at 220 clients/min began from the <default> segment and then moved on to 20 alternative user segments with equal distribution. A total of 55K clients were added to 20 segments, i.e. 10K additional clients added to the 44K clients removed from the <default> segment. Migration was marked as being complete once Serf converged.
In summary, migrating 44K clients from the <default> segment to 20 segments took 4 hours at a rate of 220 clients/min, and it took almost an additional 2 hours for gossip to converge the state of client count across all the server agents.
Results: We observed the following metrics described in Appendix D:
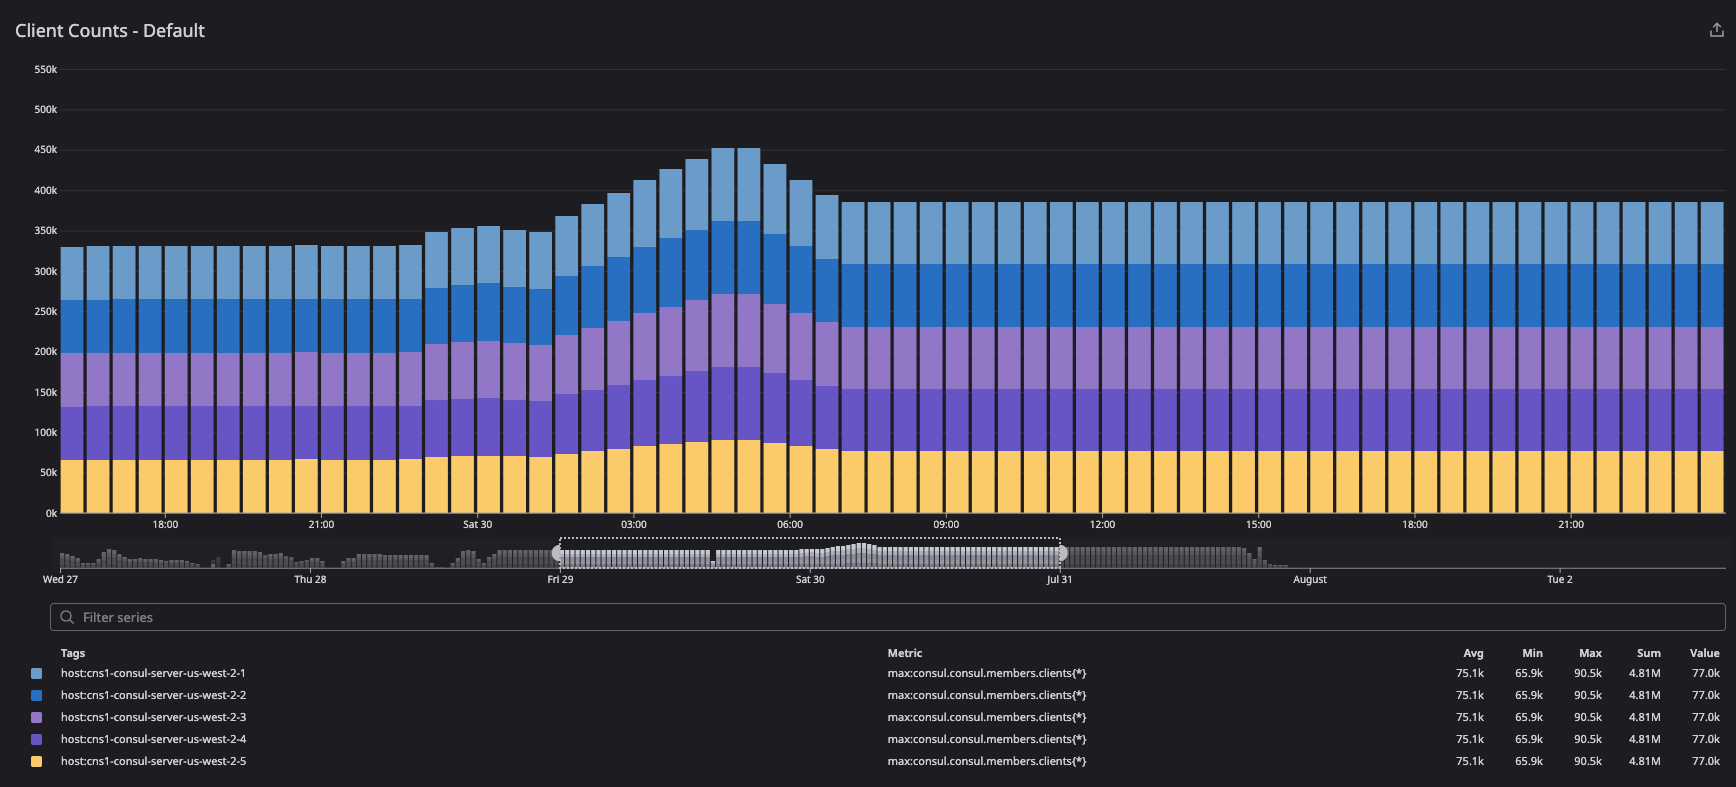
»consul.consul.members.clients
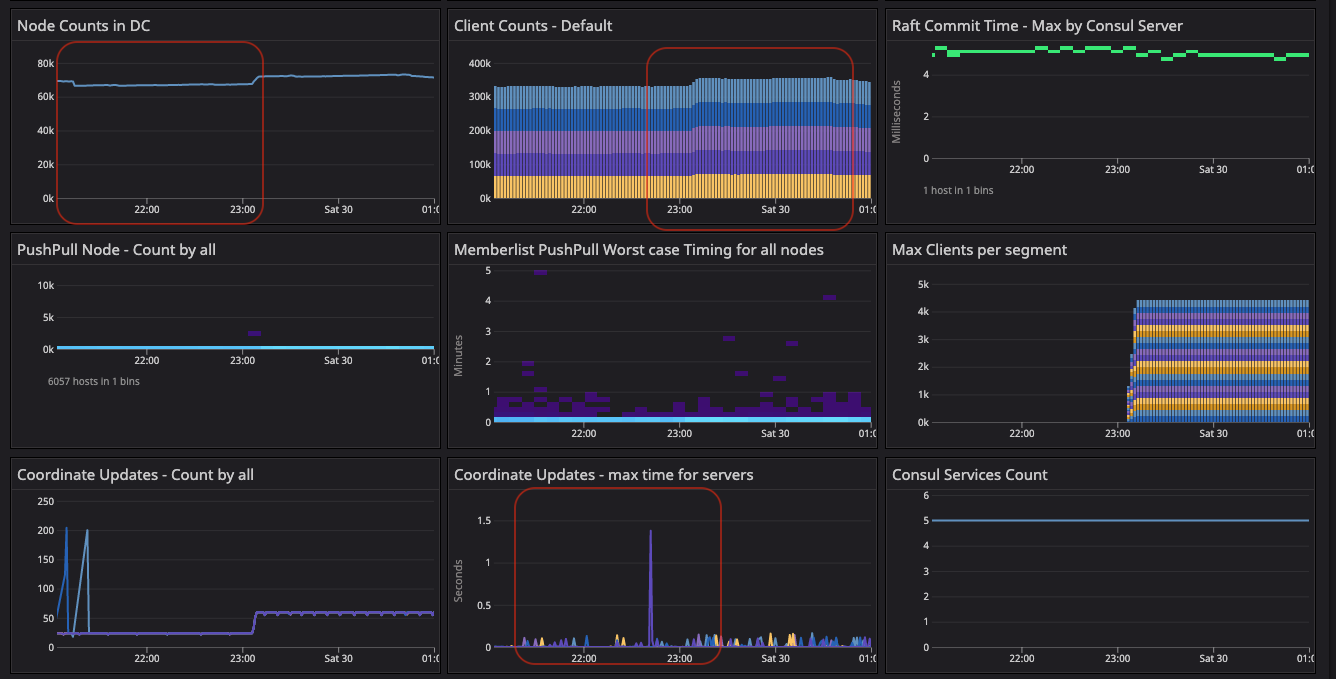
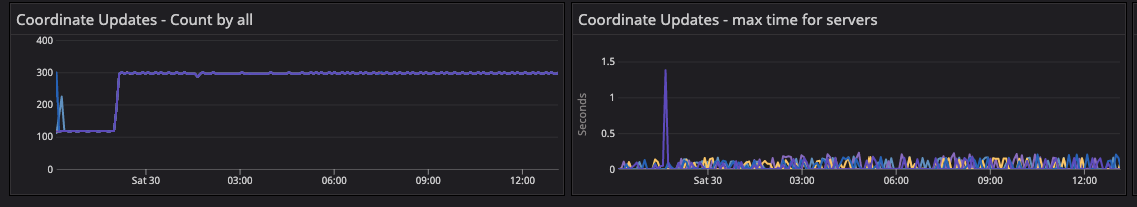
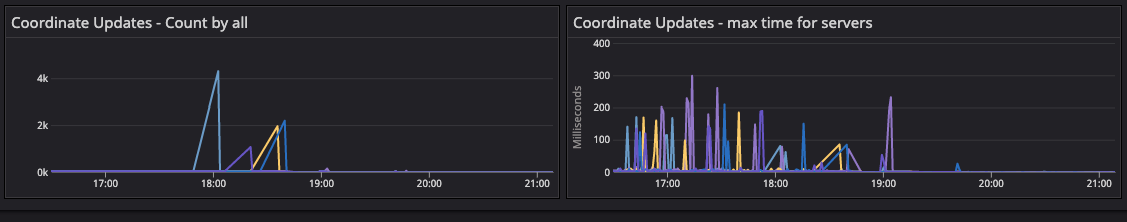
The client count increased during the migration period because clients in failed and left states were included as part of metric calculations. As migration was completed, the client count was distributed equally as intended — 77K clients across the server agents.
Also during the migration phase, finite state machine (FSM) coordinate count and time distribution were pretty much equally distributed.
This graph observes the state of client convergence at bootstrap.
This graph demonstrates client distribution across server agents.
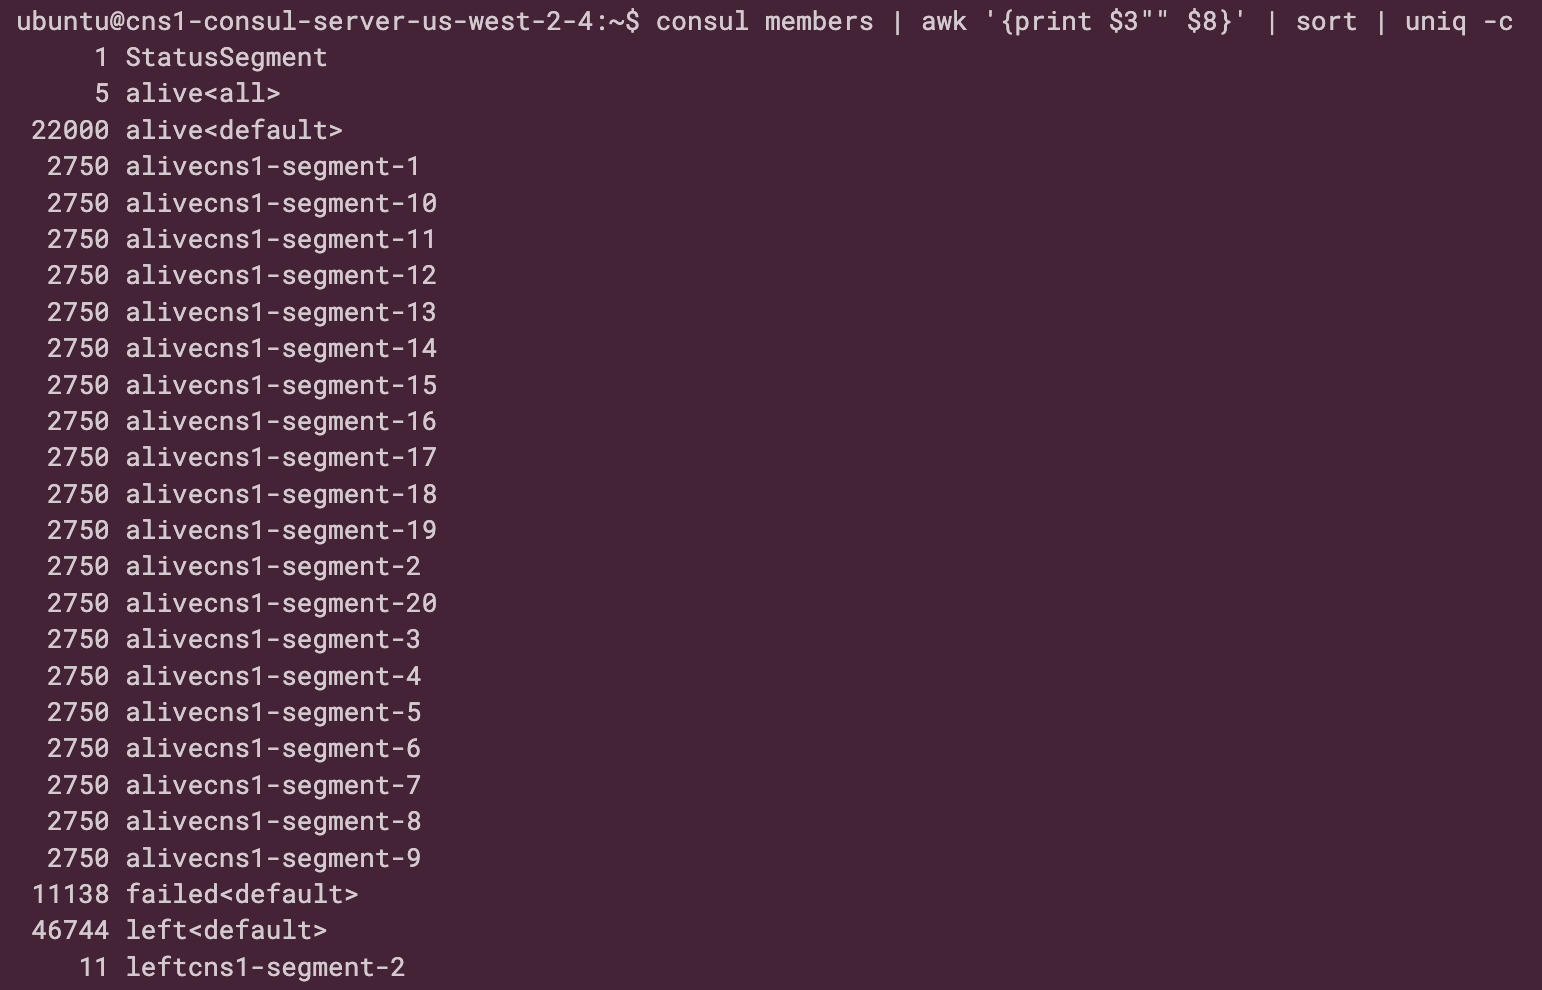
The Consul member command validates the client distribution across segments and failed nodes during gossip convergence.
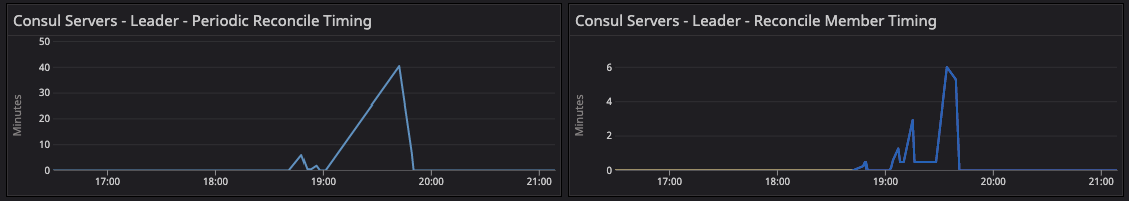
»consul.consul.leader.reconcile
During the migration phase, servers were busy reconciling the catalog as gossip converged, and there was no churning activity as it settled down.
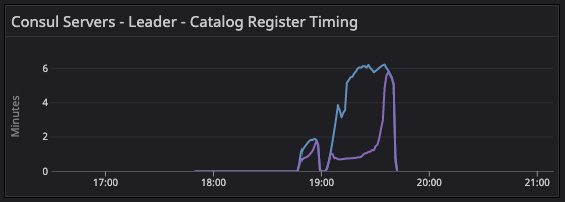
»consul.catalog.register
After server recycling, you can see this spike as it races with the reconcile loop to populate the nodes back into the catalog.
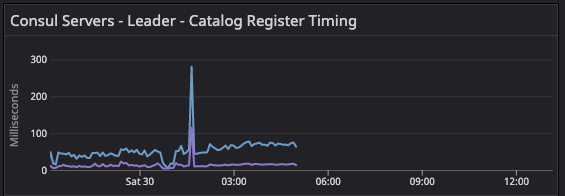
During migration of 20-segment test configuration, it observes the sharp spike as server agent restarts and agent tries to rebuild the catalog due to anti-entropy.
»Consul.fsm.coordinate.batch_update
The fsm.coordinate update metrics showed high activity during the 20-segment migration. This metric is usually a rough flat line but as we migrated to the 20-segment test configuration, a sudden spike was observed in individual server agents as all the server agents were writing the gossip coordinates to the leader for persistence in nearness calculations.
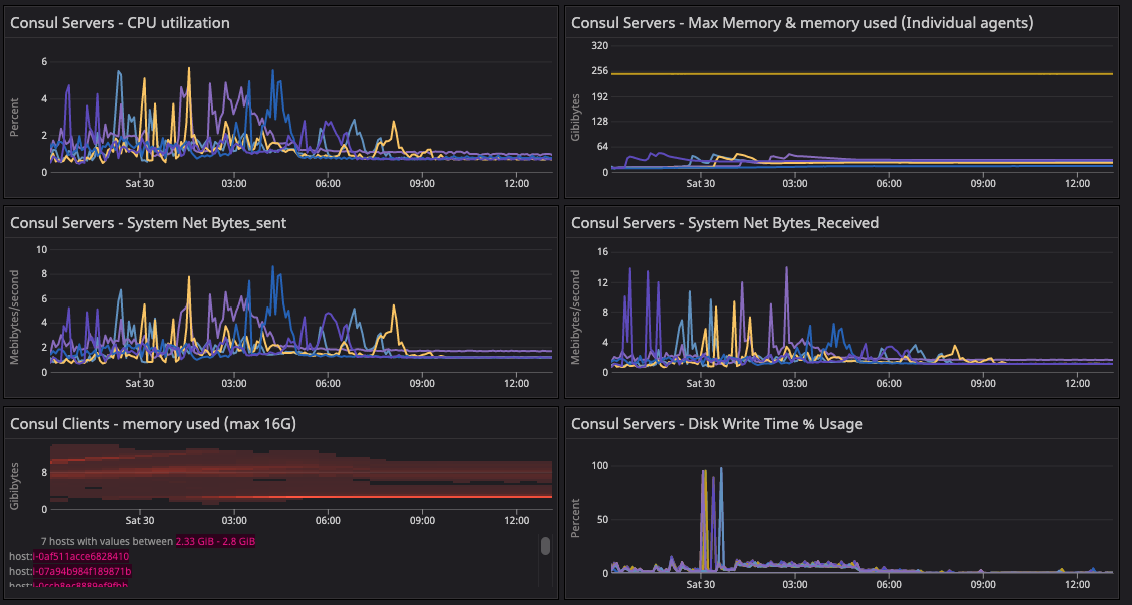
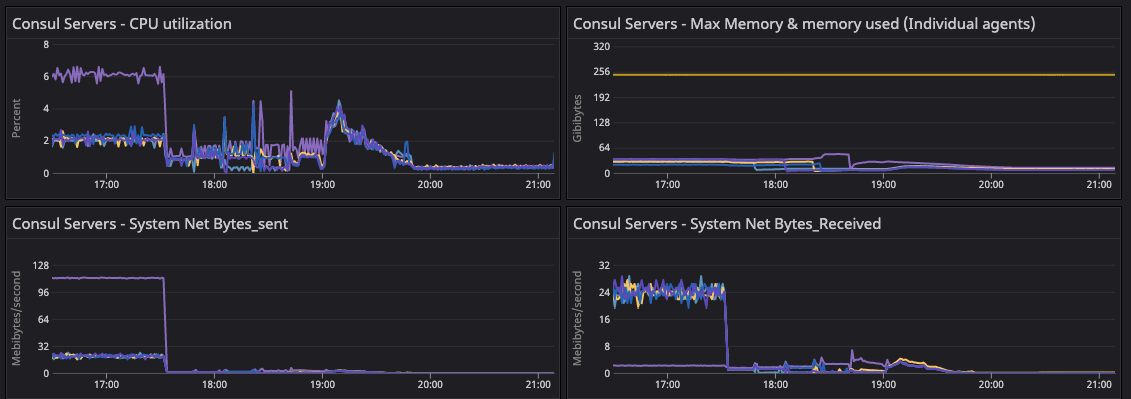
»Consul Server System Metrics
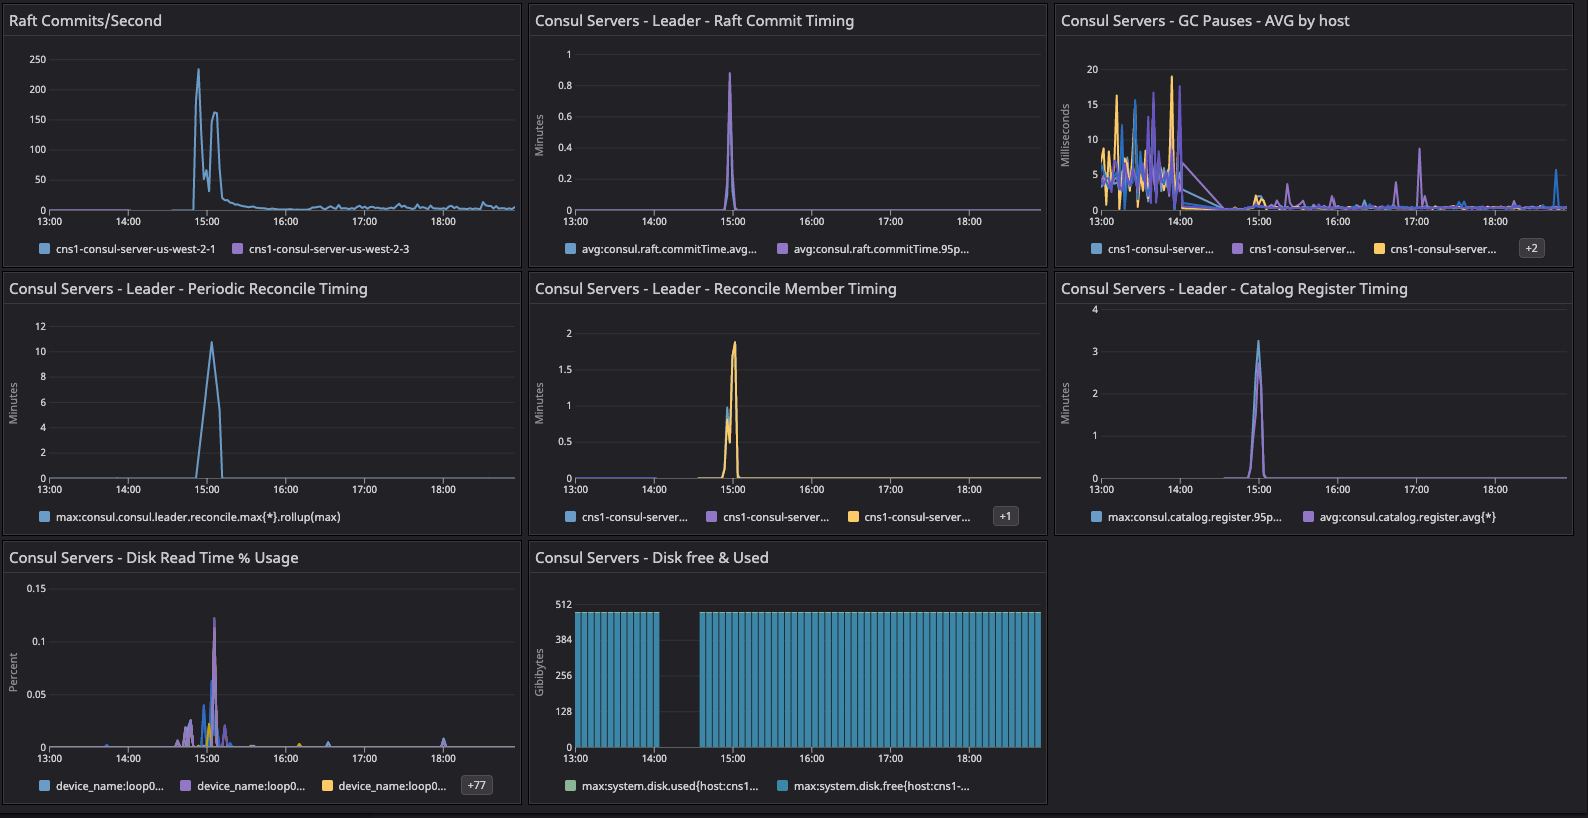
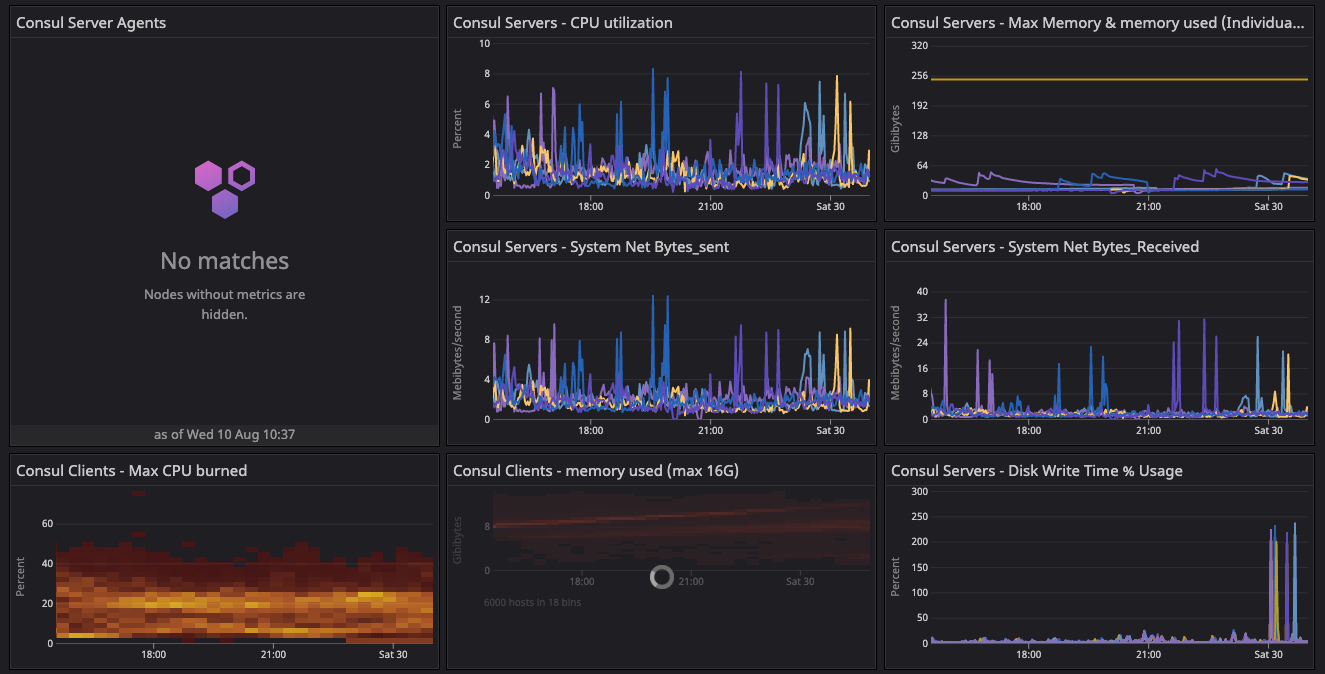
The system metrics validate the state of the infrastructure with respect to the corresponding state of gossip. This graph shares the state of the cluster during 20-segment migration. We observed any abnormal behavior in below metrics during migration of agents from default to new network segments.
»Test 3: 64-Segment Test Configuration
The 64-segment test configuration was enabled manually with similar steps to those executed in the 20-segment test by recycling the server agents. We validated the required metrics and observed the Serf distribution on all the server agents along with doing random checks on the clients.
The 64-segment test initiated migration with 55K clients in 20 segments. The 20-segment ASG dynamic policies downscaled to evenly distribute the client to 64 segments.
Results: We observed the following metrics described in Appendix D:
»consul.consul.members.clients
These results were similar to the 20-segment test except the client migration begins with 55K clients from the 20-segment configuration and is distributed across 64 segments. Convergence was observed in the test for two periods of metrics shown below and then it finished by draining all the capacity.
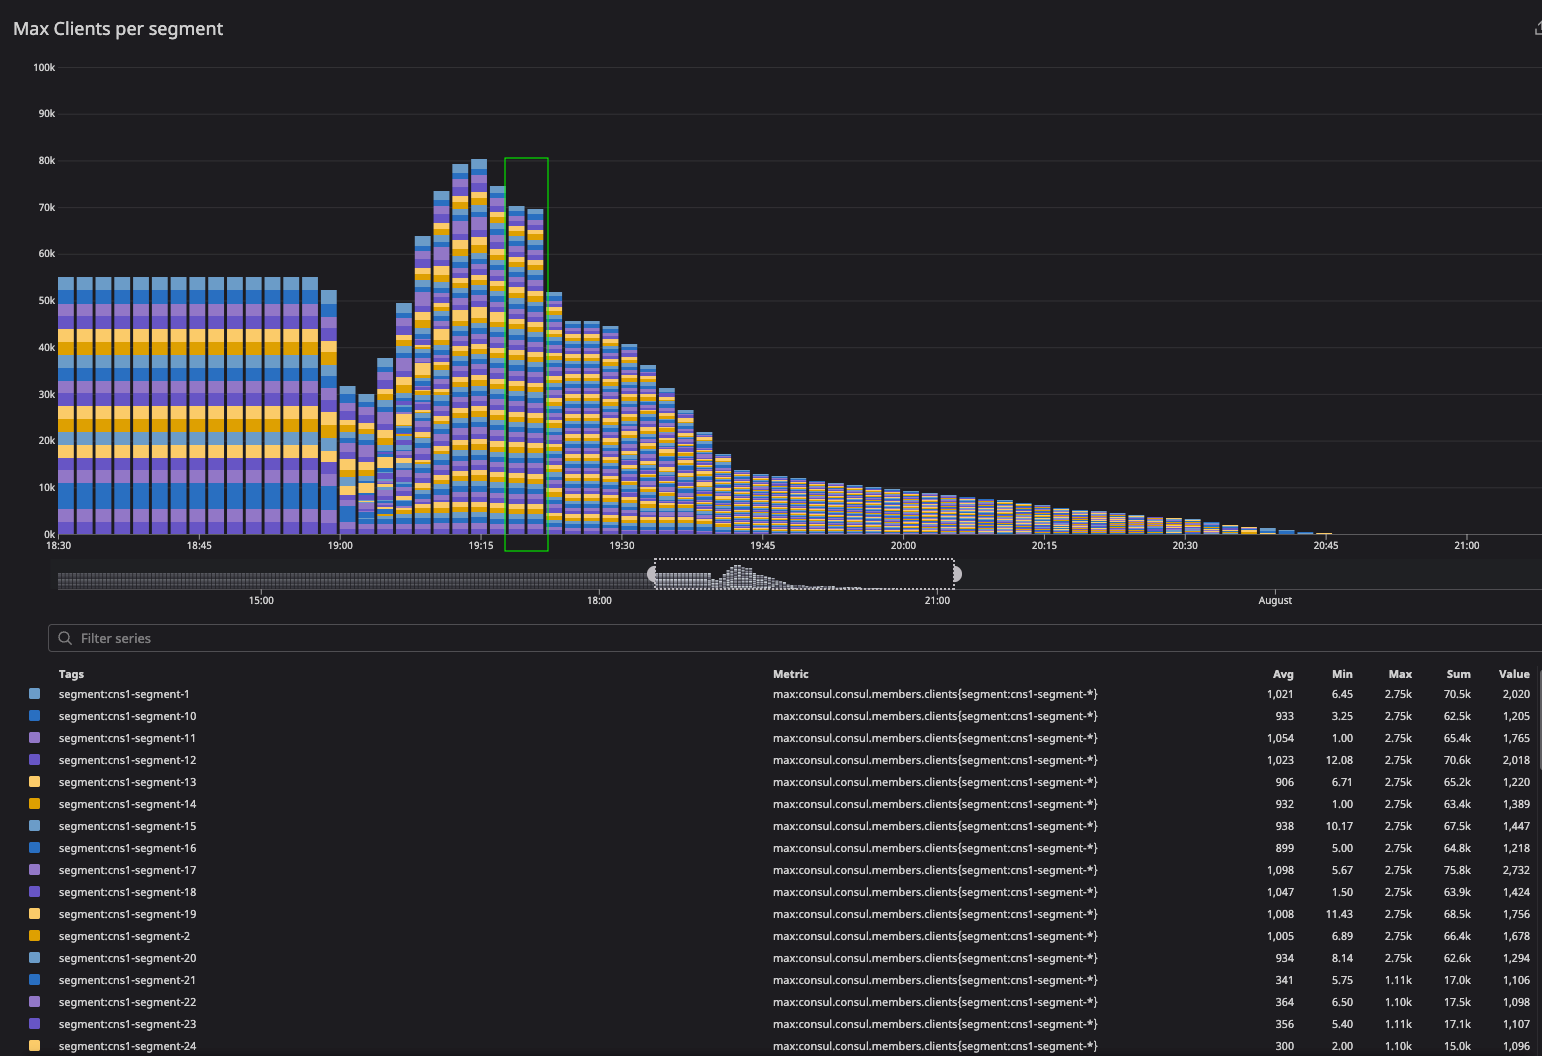
The green highlight represents the client convergence in the 64-segment test configuration where clients distributed uniformly across segments. We observed similar reflection in the server agents. This graph looks convoluted as it is really hard to capture 64-segment distribution in a screenshot.
»consul.consul.leader.reconcile
During the migration phase, the activity spiked as servers were busy reconciling the catalog. As gossip converged and there was no churning activity, it settled down.
»consul.catalog.register
After server recycling, you can see this spike as it races with the reconcile loop to populate the nodes back into the catalog.
»consul.fsm.coordinate.batch_update
The fsm.coordinate update metrics showed high activity during the 64-segment migration. We observed abnormality and sudden spikes, which confirmed the reconstruction of the gossip coordinates.
»Consul Server System Metrics
This was the observed state of the system during and after the 64-segment migration. The system metrics validate the state of the infrastructure with respect to the corresponding state of gossip.
»Summary of Results
In our Consul scale testing, we compared three test configurations and observed both the system metrics and Consul metrics emitted by agents as described in the All Key Observed Metrics section.
To assess the effect of network segment migration on gossip and server health in the 20 and 64-segment test configurations, we primarily observed server system health and the aforementioned 4 proxy metrics for gossip health:
consul.consul.members.clientsconsul.consul.leader.reconcileconsul.catalog.registerconsul.fsm.coordinate.batch_update
The evidence from these metrics indicate that:
Consul servers remained healthy under all test configurations.
Splitting a large LAN gossip pool into smaller pools with network segments reduces gossip stability risk by making the gossip converge faster.
HashiCorp received feedback from large scale Consul customers regarding the gossip stability risk for deployment running at thier scale in a single Consul datacenter. This scale-test paves a low-risk path to mitigate the gossip challenges and improve gossip stability by applying Consul network segments, a long-time Consul Enterprise feature used by customers in production to segment Consul agent gossip pools.
The test results and testing capacity showed a significant improvement in gossip stability and improved the overall health of the cluster. The primary goal was to observe a reduction in the consul.serf.queue.Intent metric, which was reduced by more than 90% post-20-segment migration and even further reduced by 4-5% after the 64-segment configuration. We also observed major improvement in system metrics as CPU and memory utilization decreased significantly.
»Optional Consideration: Align Network Segments with AWS Availability Zones (AZ)
Additionally, if there is concern about the cloud costs of cross-AZ gossip network transit, you can keep all of the members of a network segment contained within a single availability zone. No client-to-client gossip within the segment would leave the AZ. Some gossip involving server agents (which are members of all network segments) would still cross AZ boundaries, but this is negligible compared to client-to-client gossip. This would achieve a large net reduction in cross-AZ gossip network transit.
»Appendices
»Appendix A. Gossip Metrics Blackout Period
The consul.serf.* and consul.memberlist.* metrics should be ignored as soon as non-default network segments are in use.
To obtain additional insight into gossip subsystems (Serf, memberlist) once non-default network segments are in use — despite the lack of segment labels on consul.serf.* and consul.memberlist.* metrics — we observed several gossip-adjacent metrics or gossip-derived metrics instead. These proxy metrics were also observed during the un-segmented portion of the test along with the real gossip metrics to confirm they were aligned as reasonable proxy metrics. The gossip proxy metrics are:
consul.consul.members.clients: Measured per-server (mentioned above).
This is the total number of alive Serf nodes in the gossip cluster membership. It should match on all Consul servers and should also match your expected living node count. This metric is identical to consul members on a server and counting the number of alive nodes that are returned.
During membership change events (e.g. adding churn, turning on the autoscalers, switching to segments), it is expected that the servers will slightly disagree as gossip takes time to percolate around the servers. Segments with high membership counts will take longer to reach complete convergent agreement.
This graph shows the client convergence to offset the lack of network segment labels in Serf and memberlist metrics. This offers a better gauge of post-network segment migration.
consul.consul.leader.reconcile: Measured on the leader
The leader is responsible for synchronizing and storing Serf’s membership in the nodes in Consul’s catalog. For every node membership event in the system you should expect the leader to have to consider a possible change to the catalog because of it.
This metric is measured around the entire reconciliation, so if there is suddenly a lot to reconcile, then that iteration will be abnormally high. At idle status, the membership should not have a lot of work to do.
After server recycling you can see the reconciled metrics spike as all pre-existing clients suddenly need to be recreated in the empty Raft database.
consul.catalog.register: Measured on the leader
This metric is affected by any Consul client needing to perform anti-entropy corrections to its own catalog entries.
When any node joins the cluster (segmented or not) it needs to register itself into the catalog as a node.
After server recycling, you can see this spike as it races with the reconcile loop to populate the nodes back into the catalog.
consul.fsm.coordinate.batch_update: Measured on any server.
This metric is a little weird because it is measured after Raft and during the FSM apply that happens independently on all servers for committed Raft entries. If you plot it by server, they should all be doing more or less the same thing at the same rate.
Nodes continually write their gossip coordinates back into the leader for persistence in nearness calculation or consul rtt subcommand evaluation.
The periodicity of this write is a function of cluster size — it happens less frequently on larger gossip clusters. It is expected that there will be more writes to batch update as the same quantity of nodes gets put into more, smaller network segments. At steady state (no cluster membership changes) these will be happening at a fixed pace so you should expect to see a roughly flat line.
»Appendix B. Server Recycling to Reset Gossip State After Setup Steps
At several transitions between measured states listed below, we indicate that Consul servers were destructively recycled. Destructive recycling involves:
Shutting down all Consul servers
Erasing the Raft and Serf subdirectories in their data directories
Bringing each Consul server up fresh to rejoin each other
Following that, we executed a single consul join to connect the new set of five servers with the existing installed footprint of clients that were left running.
Immediately following the recycling phase, there are temporary graph spikes in the raft, reconcile, catalog, and coordinate metrics corresponding to the reconstruction of the catalog data from both client anti-entropy and Serf-to-Raft node reconciliation. The elevated metrics cease after the servers are reconstructed.
»Gossip
Server recycling accounts for the bulk of discontinuities in gossip metrics in between parts of the test, because any server-retained gossip information was purged and forced to reconstruct (or purge) the data from gossip received from the existing clients.
The first recycling happened after the initial baseline un-segmented configuration had converged. The intent of this recycling was to scrub any lingering gossip side effects of the accelerated cluster construction from the test to make it more realistic, since the established (largest Consul Enterprise) customer’s cluster wasn’t built in a matter of hours.
Later recycling events also help remove the effects of the accelerated cluster growth from carrying over into the next stage and obscuring test performance and execution.
»Raft
In all cases, the Raft/state reset was entirely optional, but it was done to make additional use of the existing large cluster to witness the performance impact of a worst-case disaster recovery scenario where all servers are lost with no snapshot restoration and all catalog data is forced to be recovered purely by Serf reconciliation and client anti-entropy.
»Appendix C. Right-Sizing the ARP Cache
One noteworthy resource issue we encountered was an undersized Linux ARP cache size, primarily on the Consul server VMs, and later also on our Consul client host VMs to a lesser degree.
While initially trying to form the baseline cluster size, the Consul servers were behaving strangely (and DNS wasn’t functioning from within the VM). A quick check of the dmesg output showed the following message repeated many, many times:
arp_cache: neighbor table overflow!After some light investigation into the origins of this error message, we stumbled onto a thread on opendev.org more familiar with the ARP cache. Quoting the commit message:
When clouds have a large number of hosts, the default size of the ARP cache is too small. The cache can overflow, which means that the system has no way to reach some IP addresses. Setting the threshold limits higher addresses the situation, in a reasonably safe way (the maximum impact is 5MB or so of additional RAM used). Docs on ARP at http://man7.org/linux/man-pages/man7/arp.7.html, and more discussion of the issue in the bug report.
For the purposes of our test, we used their values blindly as they were much, much higher than the Linux defaults:
net.ipv4.neigh.default.gc_thresh1 = 128
net.ipv4.neigh.default.gc_thresh2 = 28672
net.ipv4.neigh.default.gc_thresh3 = 32768
net.ipv6.neigh.default.gc_thresh1 = 128
net.ipv6.neigh.default.gc_thresh2 = 28672
net.ipv6.neigh.default.gc_thresh3 = 32768
After applying these to all of the servers, a quick ad-hoc monitor of arp | wc -l showed that, at peak, our Consul server VMs needed ~2000 ARP cache entries to field all of the gossip and RPC traffic before stabilizing.
We recommend that large-scale production Consul cluster deployments configure the ARP cache appropriately given their own network sizing. This is also important to remember for some disaster recovery scenarios.
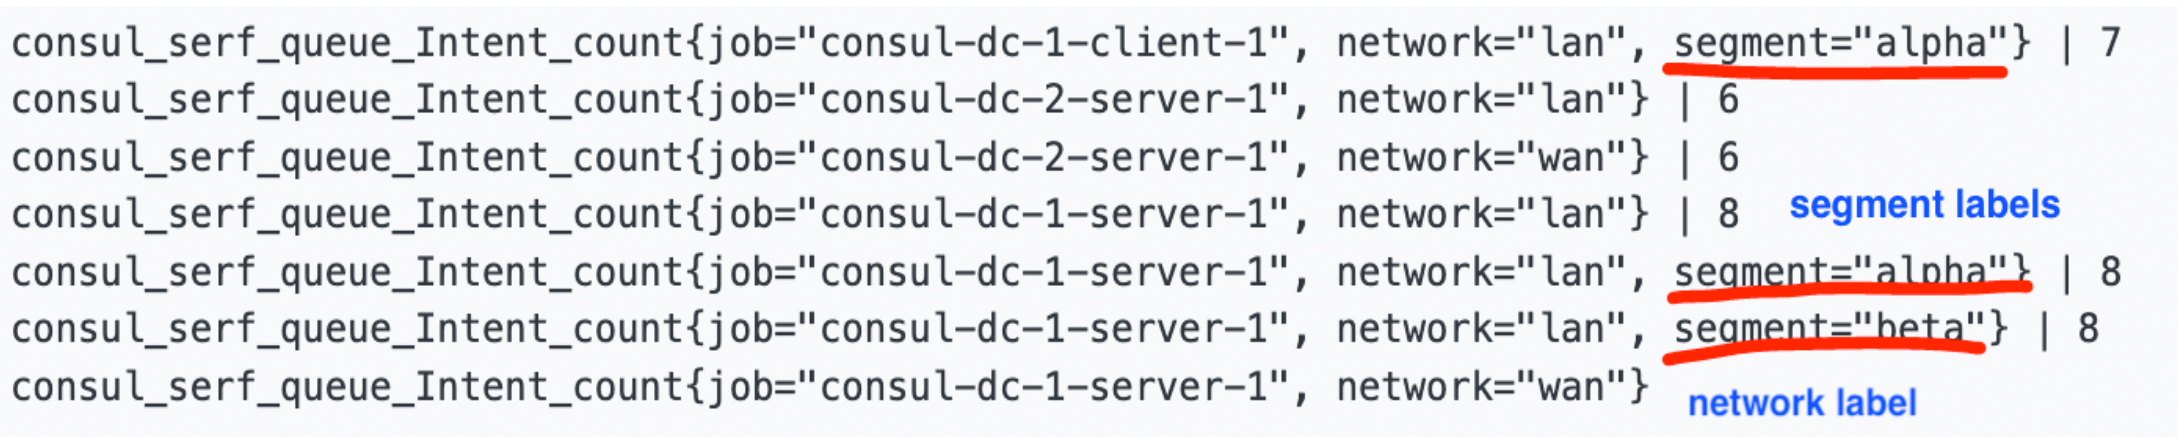
»Appendix D. Labeled Serf and Memberlist Metrics
As part of the test results, we added the new label named segment to the Serf and memberlist metrics to help monitor by distinguishing the gossip traffic between the segments. Network segment label annotation metrics are available in various Consul enterprise versions:
All release series 1.14+ent and above
Below is a screenshot of what the metrics look like with the new labels. The absence of a segment label means that the metric is associated with the default segment. The network label indicates whether this is a metric for the LAN or the WAN gossip pool. For the purposes of this post, what matters is the LAN gossip pool (i.e. the gossip within agents in a Consul datacenter).