
We are pleased to announce the release of HashiCorp Boundary 0.8 and the release of Boundary Desktop 1.4.3. Boundary provides identity-based secure remote access for dynamic infrastructure. This release includes a number of key features and improvements since the release of Boundary 0.7 in November, including:
New health monitoring observability metrics: Prometheus metrics can now be used to monitor the health of workers and controllers.
Event logs: Initially added in Boundary 0.5 and expanded in Boundary 0.8 , this feature provides a full log of all events that occur on the Boundary client.
Support for worker tags in the admin UI: Users can now set and edit worker tag filters in the Boundary admin console, allowing them to specify which workers are allowed to handle a session.
With this release, security admins can better understand and monitor their organization’s use of Boundary and infrastructure access.
»Health Metrics via Prometheus
Having visibility into Boundary workers and controllers plays an important role in ensuring the health of the production deployment. In Boundary 0.8, we are adding health monitoring capability through Prometheus using the OpenMetric exposition format, allowing administrators to collect the data and export it into a data visualizer. These metrics give insights into the operations of the workers and controllers and can be connected to a data visualizer for increased functionality such as building dashboards. This is an initial set of operational metrics and we plan to add more in the future. To learn more about specific metrics and how to access them, please see the Boundary documentation for metrics as well as our metrics HashiCorp Learn guide. In addition, we are also exposing a health endpoint that can provide information on the controller health service.
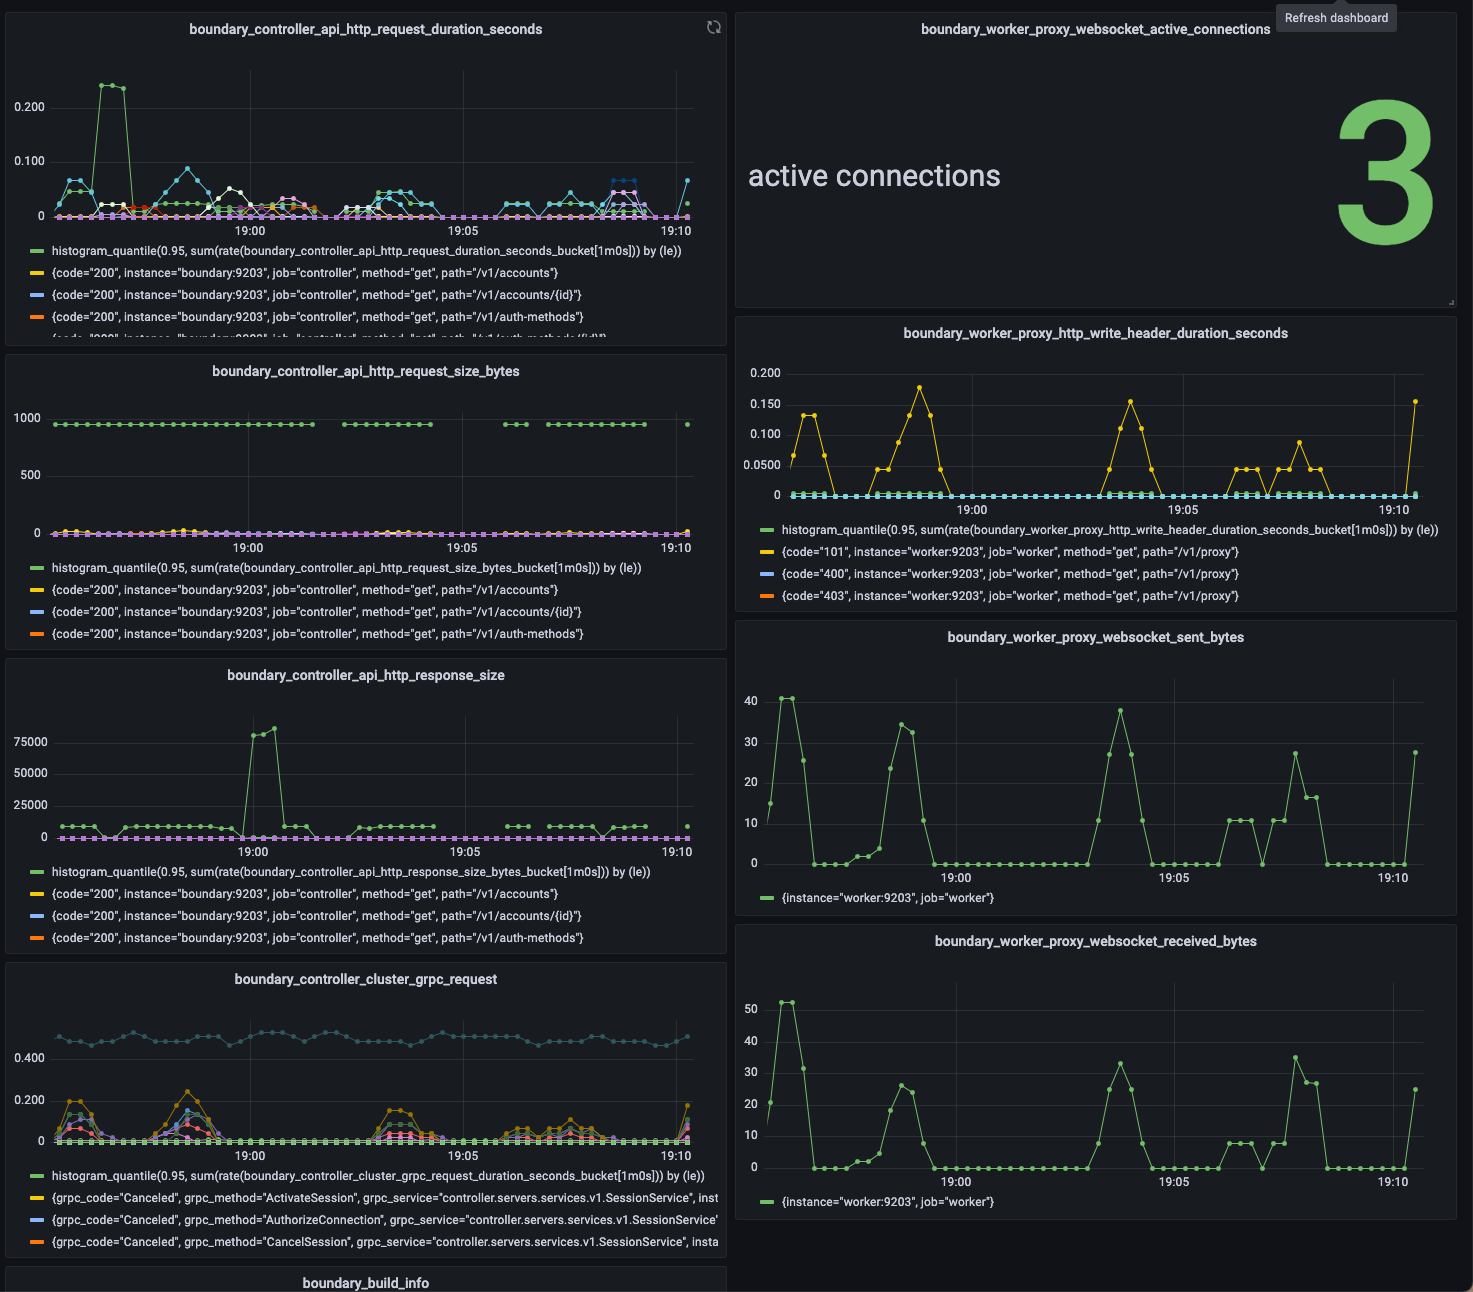
Grafana dashboard using Prometheus metrics
»Audit Event Logs
Beginning with Boundary 0.5, a variety of event types are emitted from Boundary; including errors, observations, and system information. These events can be emitted in several formats such as cloudevents and hclog, and can be encoded as text and JSON. In Boundary 0.8 we have added support for sanitizing sensitive information from audit events. All of the events are now classified and contain additional usable data, such as attributes on requests and responses. In addition, users can configure which sensitive information is encrypted or redacted. Examples of information found in event logs include:
Which users used which credentials
Boundary client information about every connection, such as which user connected and to which target
Target access statistics, including who it was accessed by and when
Event logs can be accessed by saving the file/console or streamed to an external log management service such as ElasticSearch or Graylog.
The events stanza configures Boundary events-specific parameters, and you can learn more about events and sinks by visiting our documentation for controller/worker events. The default events stanza is shown below:
events {
  audit_enabled = false
  observations_enabled = true
  sysevents_enabled = true
  sink "stderr" {
    name = "default"
    event_types = ["*"]
    format = "cloudevents-json"
  }
To filter events, common sink parameters can be used, including allow_filters and deny_filters, which use the standard filter syntax in Boundary. An example allow_filter that can be used when running boundary dev is shown below:
boundary dev \
    -event-allow-filter '"/Data/request_info/Path" contains ":authenticate"' \
    -event-allow-filter '"/Data/Op" contains ".createClientConn"'
»Data Warehouse
Boundary’s data warehouse in the PostgreSQL database offers a great way to investigate security incidents that occur and involve human access to machines. The data warehouse tables are organized in a star schema and can be used with a security information and event management (SEIM) tool like Tableau to dig deeper into an incident to discover information such as which user accessed a specified host during a specific period of time. We plan to continue building content on this topic in the future, so please share your thoughts on what you'd like to see on our GitHub or Discuss forum.
Note: If you are trying to access data stored in the PostgreSQL database (including the data warehouse), it is strongly recommended that you create a read-replica of the database before using visualization software or running queries. This is to avoid performance issues that can impact user experience. Operational data store schemas are not optimized for business intelligence activities, such as creating dashboards for visualizing access, which can create problems.
»Upgrade Details
Boundary 0.8 introduces significant new functionality. Please review Boundary’s general upgrade guide and release notes for details.
As always, we recommend upgrading and testing this release in an isolated environment. If you experience any issues, please report them on the Boundary GitHub issue tracker or post to the Boundary discussion forum. As a reminder, if you believe you have found a security issue in Boundary, please responsibly disclose it by emailing security@hashicorp.com — do not use the public issue tracker. Our security policy and our PGP key can be found on the HashiCorp security page.
We hope Boundary 0.8 improves access observability for your organization!