

The importance of organizations integrating observability platforms into their workflows continues to be a critical step in building and maintaining a strong “security-first,” posture. Observability platforms give organizations greater flexibility when streaming their audit logs and performance metrics into automated threat detection and incident response workflows.
Previously HCP Vault offered three industry-standard core integrations with top-tier observability platforms: Datadog, Grafana Cloud, and Splunk. A few use cases that users have opted for with these platforms include identification of suspicious user activity, capacity planning, and cost optimization in order to reduce client count.
HCP Vault will now allow users to directly integrate their production-grade clusters with three new top tier observability SaaS providers which include: Amazon Cloudwatch, Elasticsearch, and New Relic.
Additionally, HCP Vault will now be providing a feature for administrators and contributors to set up audit logs and metrics streaming via HTTP. This will allow users who do not have a supported dashboard/integration through an observability provider to proceed with setting up log/metrics streaming.
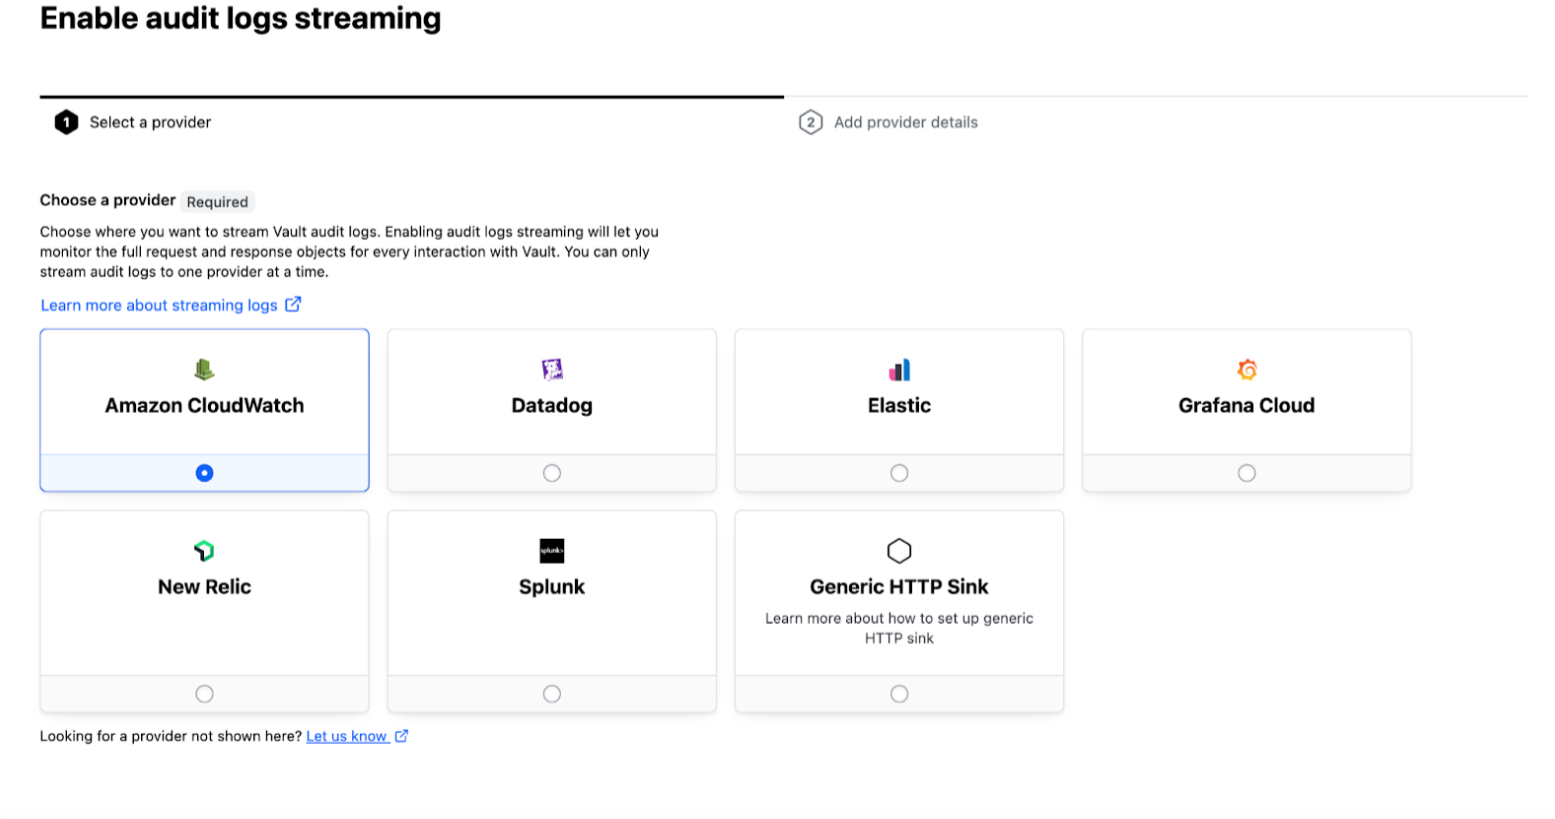
HCP Vault allows users to select an observability provider in order to stream Vault audit logs.
»HCP Vault and observability
HCP Vault compiles audit log data and performance metrics from your HCP Vault cluster to provide users with both security and operational insights that can help better inform management decisions. Performance metrics provide an opportunity for users to optimize client usage patterns to better manage and reduce costs. Additional metrics provide insights that allow users to identify suspicious usage patterns.
Performance metrics are scoped to best practice, user-actionable information in a managed service context. See the HCP Vault Metrics Guide for a full list of exported metrics and how to use them. For instructions on configuring metrics streaming to your existing external SIEMs, see the documentation.
»Sample use cases and metrics
These turnkey log and metrics integrations allow customers to enhance security operations, plan for sufficient infrastructure capacity, and identify opportunities to optimize usage patterns for cost savings.
Examples include:
Identification of suspicious usage patterns: By tracking steady-state usage patterns and watching for anomalies like tokens with unexpectedly long time-to-live (TTL), unexplained spikes in new admin tokens, or unusual policy creation behaviors, security issues can be quickly identified, investigated, and remediated. These same metrics and events will help security teams identify opportunities to harden internal security practices.
Capacity planning: Latency metrics for key Vault operations, like token revoke and renew latencies, as well as the comparison of Vault usage trends to host performance metrics can inform whether the cluster needs to be resized to meet anticipated demand.
Cost optimization: Client count can impact cost. Identifying the infrastructure and organizational sources of tokens can help drive client reduction efforts, for example through the use of entity aliases.
»Getting started with HCP Vault observability
Please find specific instructions on configuring your metrics or audit logs streaming for your existing observability provider below:
For a full list of monitoring telemetry and audit device logs for HCP Vault, check out Vault’s cloud monitoring documentation.