

Update: For the most up to date information on distributed tracing in Consul service mesh (Connect), visit our distributed tracing documentation.
In control theory, observability (o11y) is a measure of how well internal states of a system can be inferred from knowledge of its external outputs. In more practical terms, observability consists of tools and techniques to make sense of complex systems. These systems range from applications to infrastructure.
»The Three Pillars of Observability
A robust observability program focuses on three key areas:
Metrics: Numeric representations of data measured over intervals of time. Metrics provide data about your services that help you troubleshoot issues, gauge system health, and test hypotheses. Metrics can be technical such as requests per second, error rate, or CPU utilization. Metrics can also be business-specific, for example, the sum of goods sold per hour, average order value (AOV), or click-through-rate (CTR).
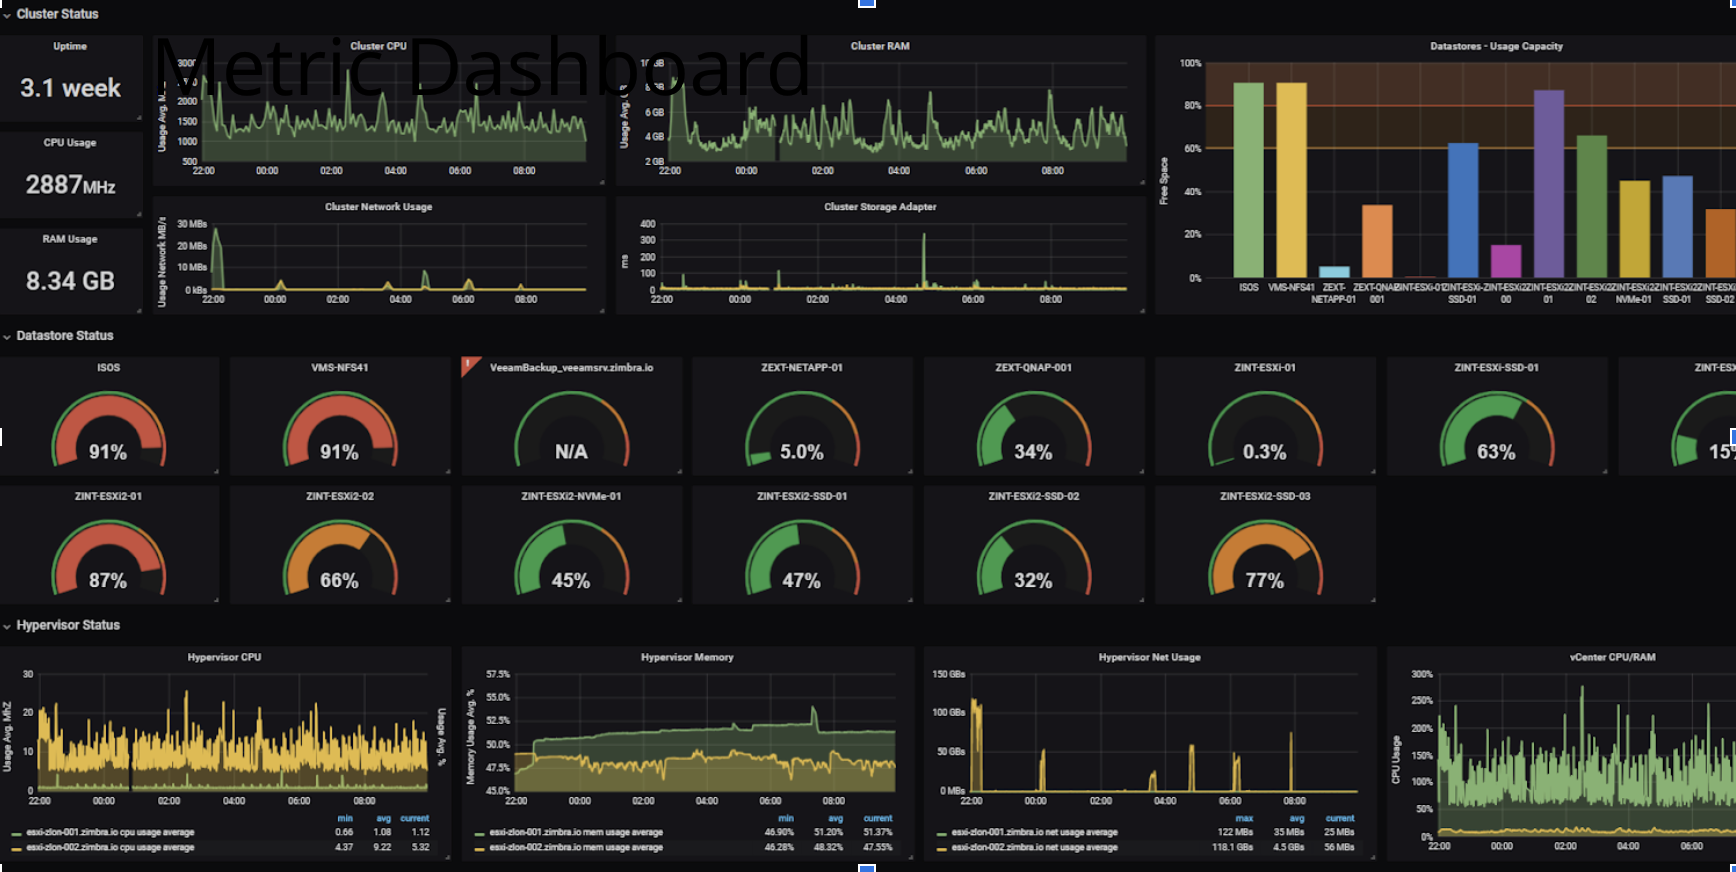
A Grafana Metrics dashboard example
Logs: Immutable, timestamped records of discrete events that happened over time. Logs are the most common resource that developers use to collect data and quickly debug their code, as they provide more detailed data than metrics.
Traces: Representations of a series of related distributed events that encode the end-to-end request flow through a distributed system. Traces represent the lifecycle of a request through various services and help pinpoint problematic services, such as ones with high latency.
While achieving observability for your systems, there are generally three approaches: Do-it-yourself (DIY), buy, or in some cases a hybrid of both.
»DIY or Buy
Observability tools come in two varieties. Open source (OSS) build-it-yourself tools and commercial offerings.
»DIY (left) or Buy (right)
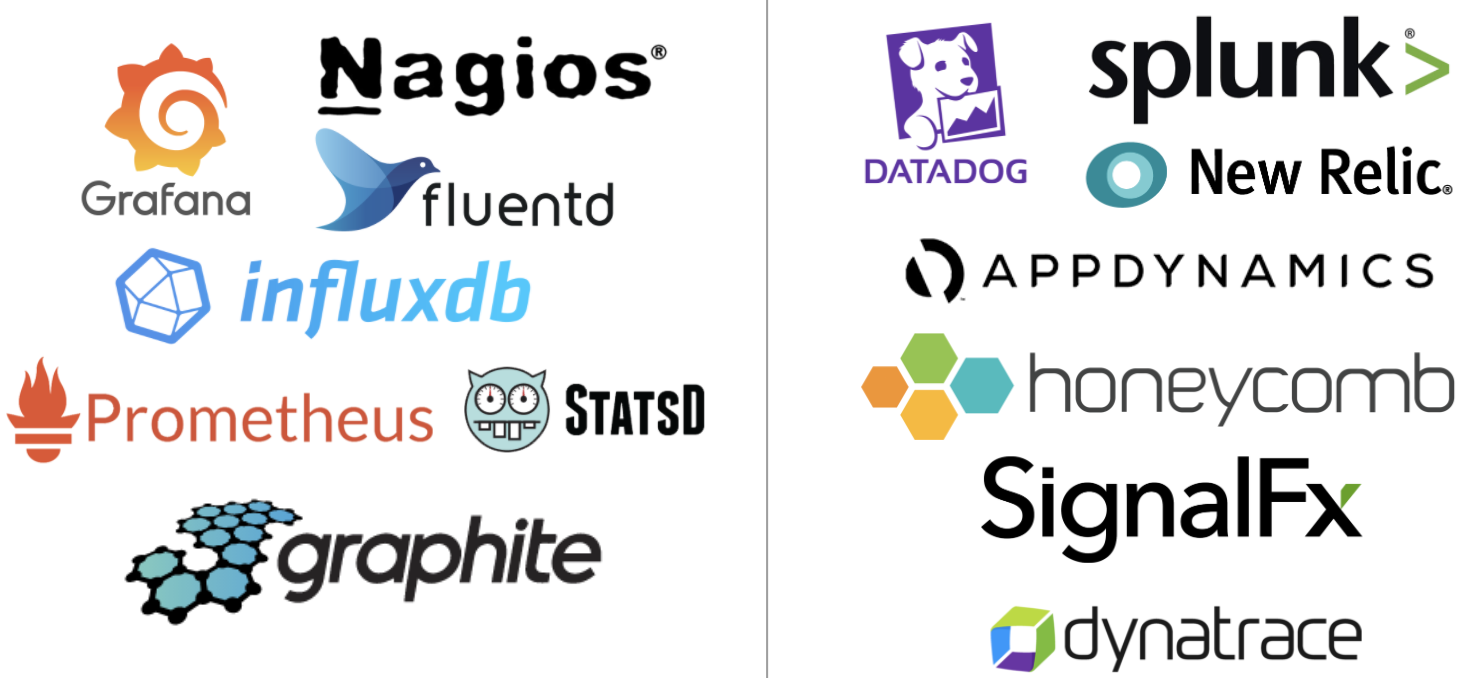
There are pros and cons to both approaches. OSS tools provide users a simple way to start monitoring their applications and services. There are plenty to choose from. One can build a reasonable monitoring stack with Prometheus and Grafana for metrics and dashboards.
One important question to ask while planning for observability is how does your o11y strategy align with the overall goals of your organization. For example, whether your organization is a video game startup or a well-regarded financial services firm, the value of the products your company sells depends on the quality of experience those products deliver. As such, one should consider prioritizing engineering resources on creating differentiated experiences for your customers — instead of maintaining an o11y stack.
»OSS Benefits and Implications
There are long term implications for those considering the OSS route. While OSS tools are freely available and easy to get started with, OSS tools require dedicated engineers to maintain, update, and support them in the long run. The long term costs of upkeep may be significant and should be considered while developing an observability strategy.
»Why Organizations Choose SaaS
Commercial offerings are typically SaaS products that alleviate engineering teams from building and maintaining their own observability stack. In addition, commercial products typically provide out-of-the-box (OOTB) dashboards with contextual information for your applications and services. For extremely high-traffic applications and services, highly ephemeral workloads, or workloads that generate highly cardinal data, commercial products are often the only observability solution able to capture the complex data generated by these workloads.
»New Compute Primitives Require New Observability Methods

Evolving application delivery
The progression of the compute stack from bare metal hosts to VMs to containers has led to an evolution of the application delivery model from monolithic apps to microservices. Monolithic apps can easily be monitored by applying agents to the application. For example, a monolithic Java application can be monitored by instrumenting the application with a Java agent that is passed as a JVM argument while running the app. Most monitoring platforms provide agents for a wide variety of languages.
We replaced our monolith with microservices so that every outage could be more like a murder mystery. — @honest_update
While microservices provide many benefits over monolithic apps, there are also tradeoffs. Since microservices decouple an app’s functions into many discrete components, a microservices app is inherently more complex than a monolith. Fortunately, distributed tracing solves the challenge of observability for microservices applications.
The span is the primary building block of a distributed trace. A span represents an individual unit of work done in a distributed system. Spans generally contain references to other spans, which allows multiple spans to be assembled into one complete trace. A trace is a visualization of the life of a request as it moves through a distributed system.
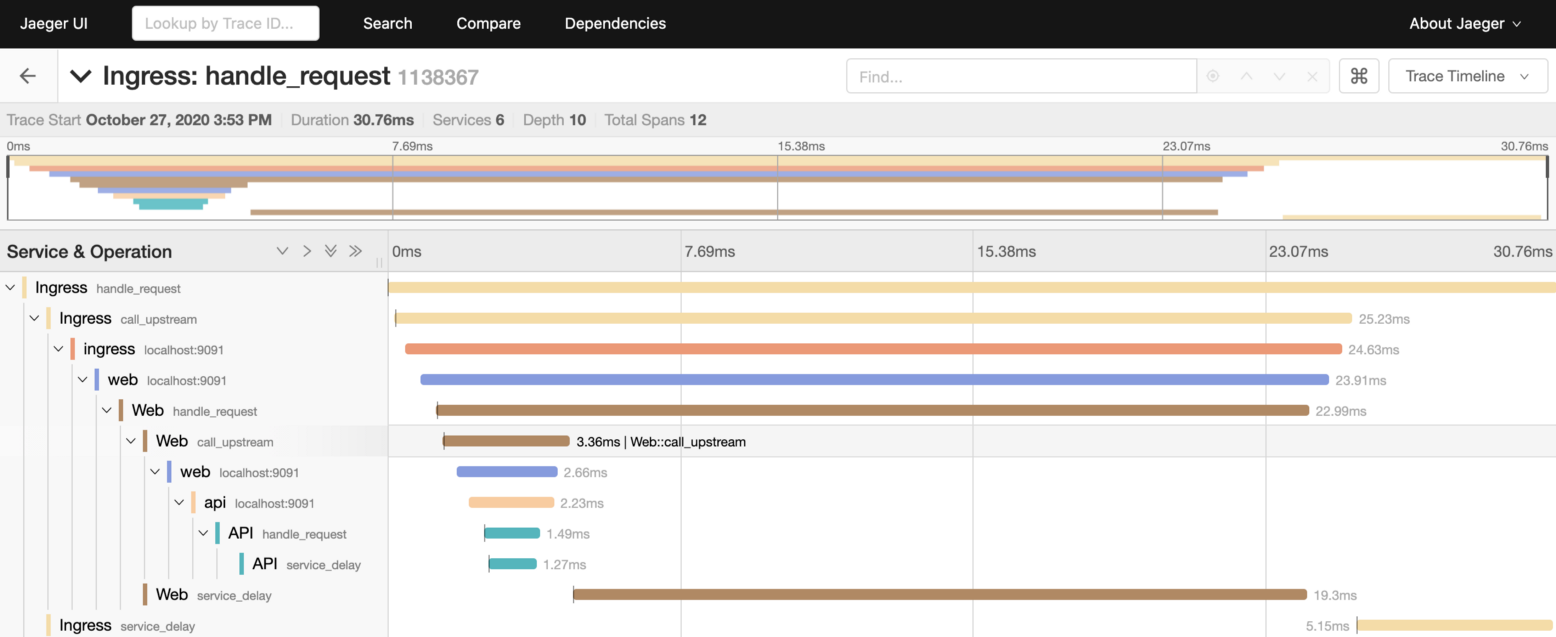
Example of a trace in Jaeger
»Consul Service Mesh
HashiCorp Consul provides service-to-service connection authorization and encryption using mutual TLS. Applications can use sidecar proxies in a service mesh configuration to establish TLS connections for inbound and outbound connections without being Consul aware. Consul Service Mesh helps you secure your services and provide data about service-to-service communications.
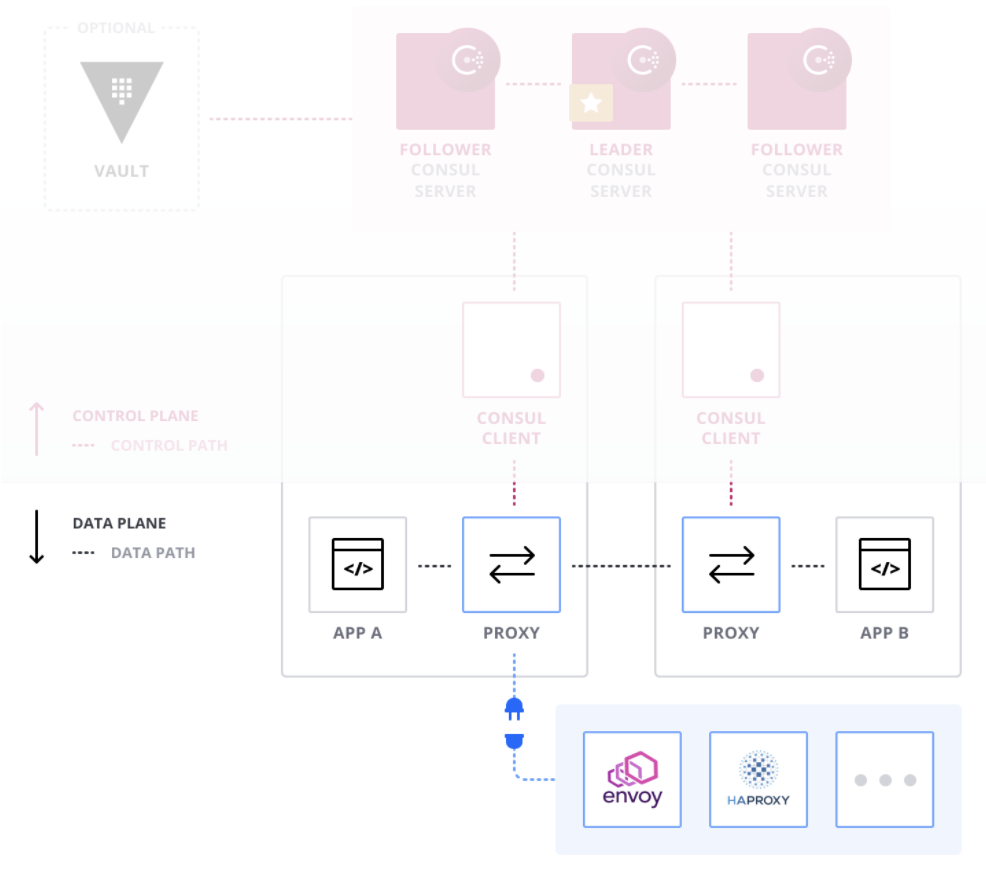
Consul Envoy Proxy
There are two basic methods to implement distributed tracing for your services. You can either
Instrument your code directly, or
Leverage the observability hooks of your service mesh.
Consul has first-class support for using Envoy as a proxy. With Consul, we can configure its Envoy sidecars to enable distributed tracing.
»Direct Instrumentation
Below, we will demonstrate how to instrument two services written in Go for distributed tracing with Datadog. If you don’t have an existing Datadog account, feel free to register for a trial. The 2 services are the:
In main.go of the Counting Service
import (
	"encoding/json"
	"fmt"
	"log"
	"net/http"
	"os"
	"sync/atomic"	"github.com/gorilla/mux"
)
We replace github.com/gorilla/mux with the following Datadog go tracing libraries.
import (
	"encoding/json"
	"fmt"
	"log"
	"net/http"
	"os"
	"sync/atomic"

	muxtrace "gopkg.in/DataDog/dd-trace-go.v1/contrib/gorilla/mux"
       "gopkg.in/DataDog/dd-trace-go.v1/ddtrace/tracer"
)
and add a tracer.Start()
func main() {
   //adding a tracer    tracer.Start(
   tracer.WithService("counting-service"),
   tracer.WithEnv("dev"),
)....//replacing router//router := mux.NewRouter()
router := muxtrace.NewRouter().....//adding defer tracer.Stop()fmt.Printf("Serving at http://localhost:%s\n(Pass as PORT environment variable)\n", port)
log.Fatal(http.ListenAndServe(portWithColon, router))
defer tracer.Stop()
Now that we’ve instrumented the Counting service, we also need to instrument the dashboard’s service main.go (instrumented version).
See the updated main.go (Counting), main.go (Dashboard) for both services by cloning my forked repo. Following the instructions to install the Datadog agent with APM enabled and running main.go for both services, we’ve successfully instrumented both services for distributed tracing.
»Install Datadog Agent
docker run -d -v /var/run/docker.sock:/var/run/docker.sock:ro \
-v /proc/:/host/proc/:ro \
-v /sys/fs/cgroup/:/host/sys/fs/cgroup:ro \
-p 127.0.0.1:8126:8126/tcp \
-e DD_API_KEY=<YOUR_API_KEY> \
-e DD_APM_ENABLED=true \
datadog/agent:latest»Install the Go Tracer
go get gopkg.in/DataDog/dd-trace-go.v1/ddtraceAfter starting both services by running both main.go, go to http://localhost:9002/ in your browser to access the Dashboard service

Dashboard Service
Access Datadog APM to see your traces:
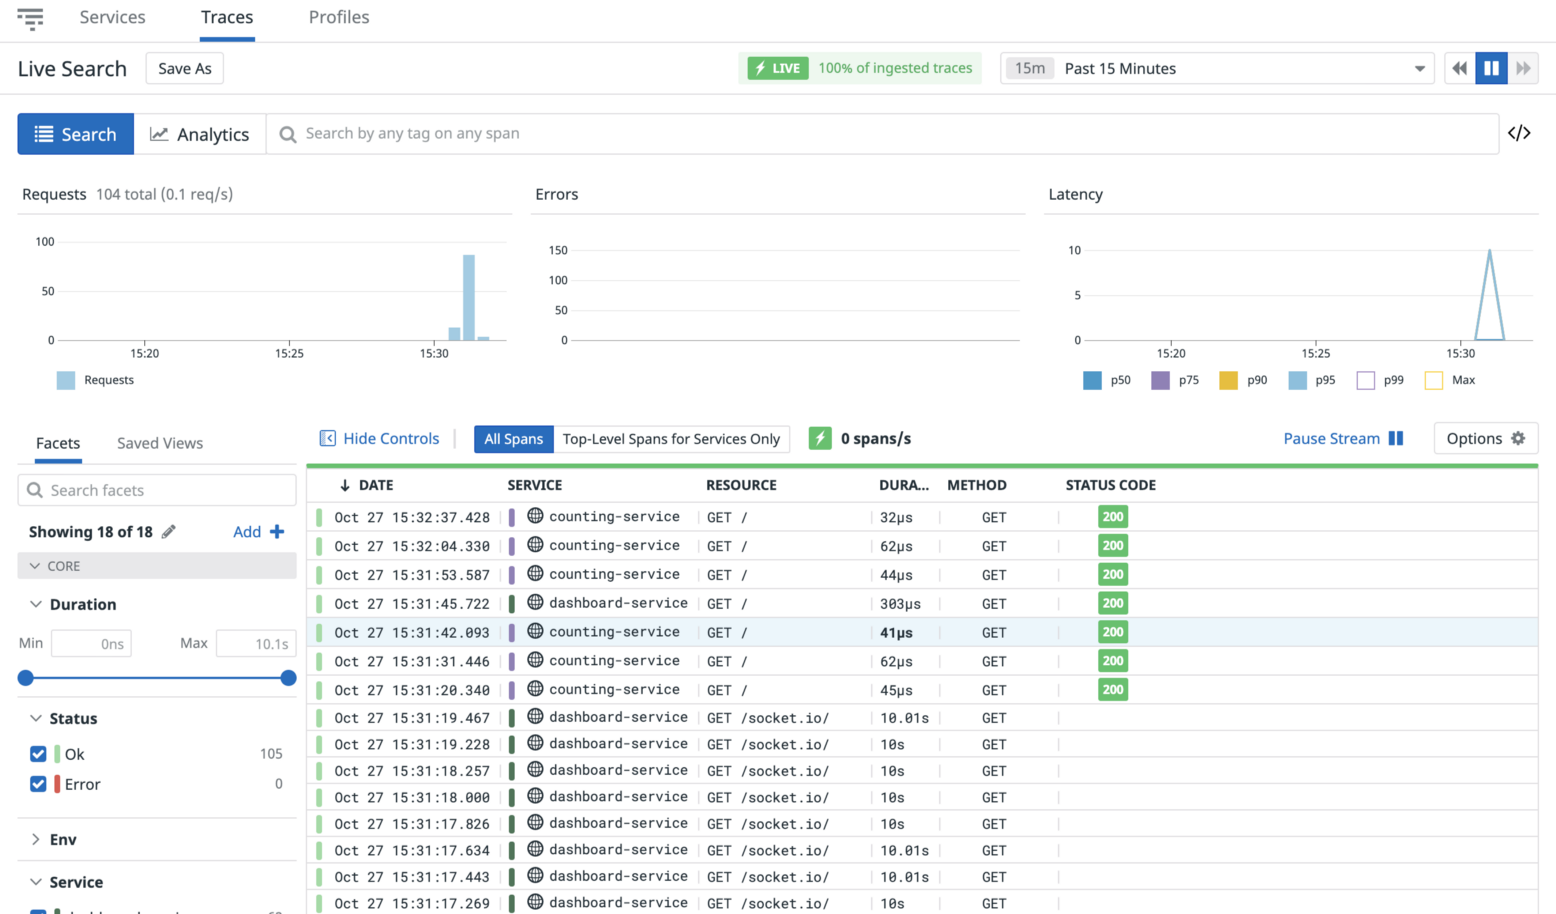
Trace List
»Consul Service Mesh Envoy Proxy Traces
This repo demonstrates how we can leverage the existing observability features of the Envoy proxy to generate traces to Jaeger and Datadog.
> export DD_API_KEY=<YOUR_DD_API_KEY>
> docker-compose up
> curl localhost:9090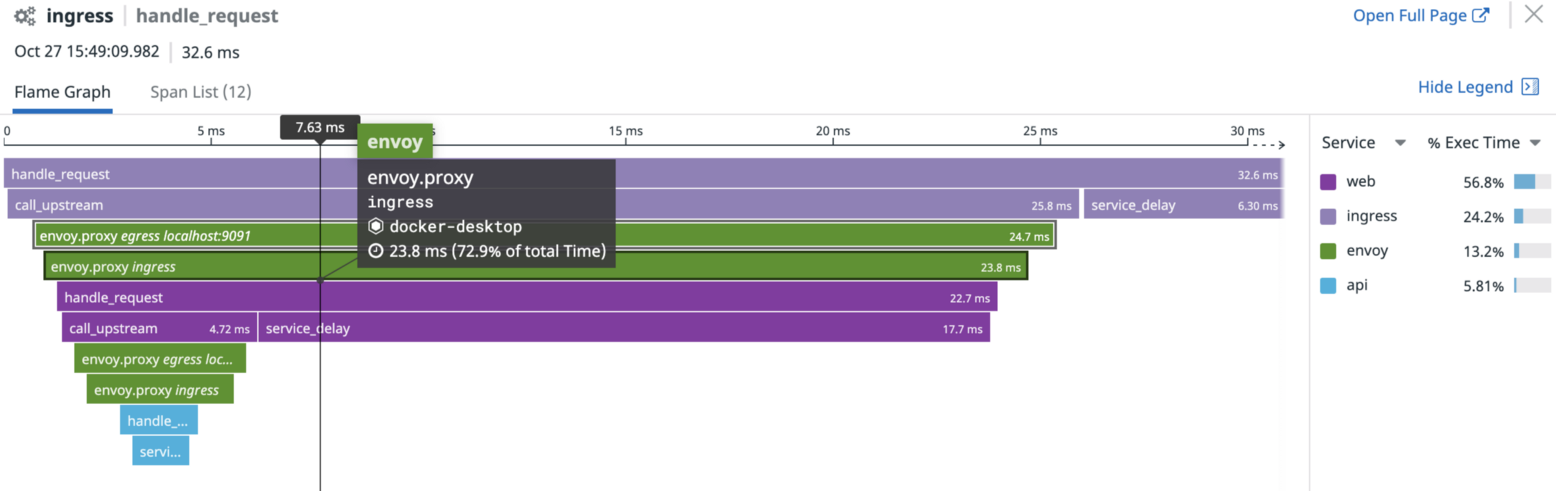
Traces rendered in Datadog
»Conclusion
In a world of heterogeneous technologies and complexity, observability should be a vital component of your organization’s digital transformation program. This blog post has demonstrated how we can apply distributed tracing with Consul Service Mesh to achieve one of the Three Pillars of Observability. In addition, we have some exciting news, Consul 1.9 will offer service mesh visualization natively. To get started with Consul, please visit HashiCorp’s Consul Learn site.
Check out HashiCorp Learn for more Consul tutorials:


