
When you update an application or system, you likely push the changes to production and manually verify whether or not it works. If the changes fail, they could have a wide impact across your system and users. Instead, you can use a canary deployment to send a small percentage of traffic to new versions of an application or system. This reduces the blast radius of any problems because you can check if the change failed with a smaller subset of users. But canary deployments often require someone to analyze application metrics and then manually increase the percentage of traffic to the new application. A manual canary deployment can take days, especially if you need to wait for more data before increasing traffic!
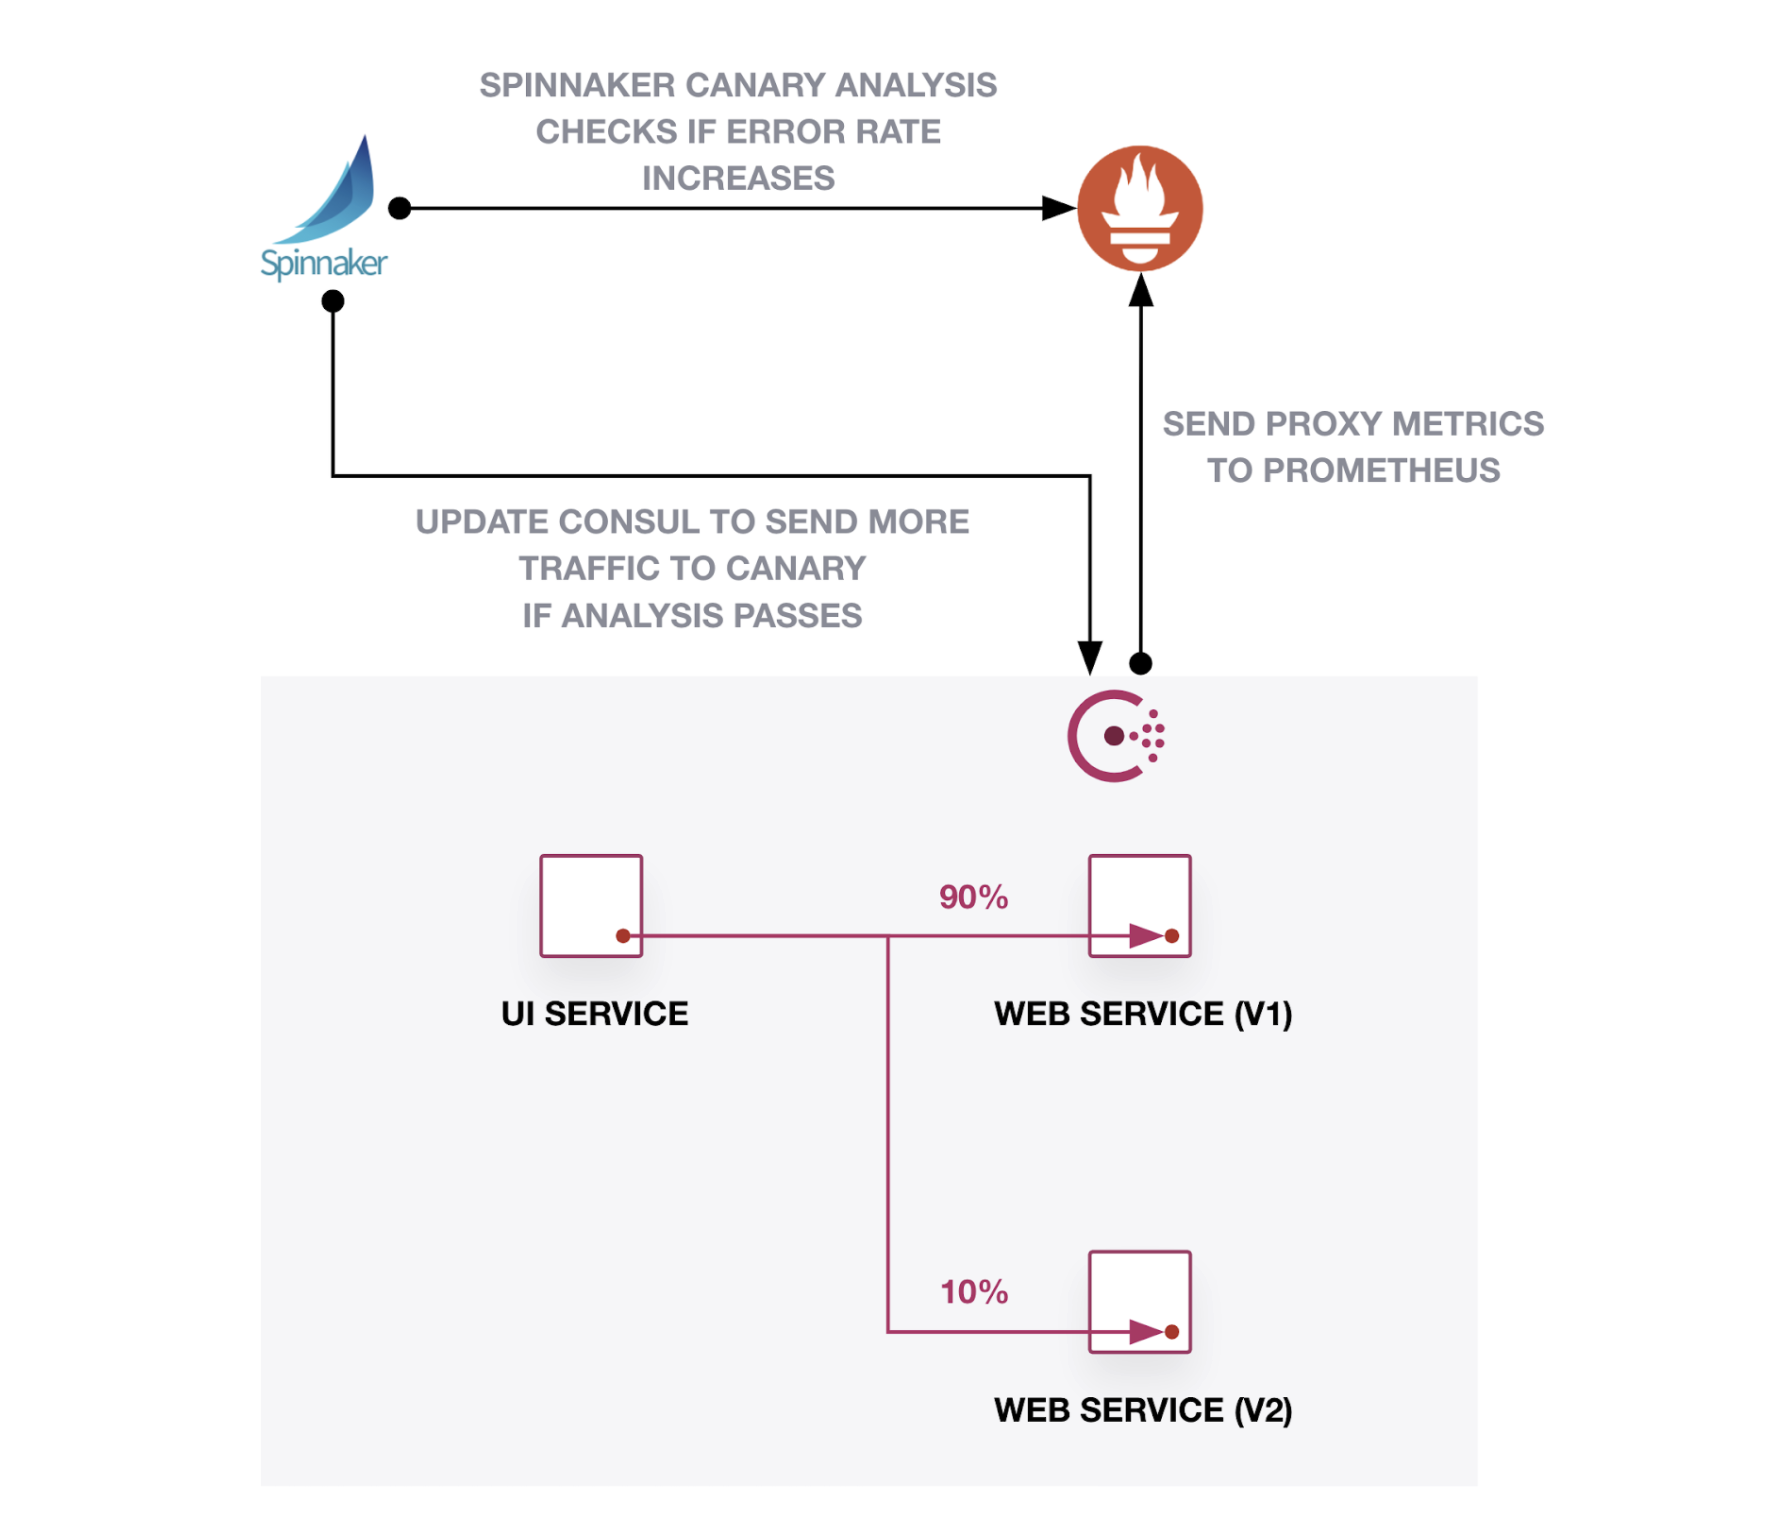
This post will show how to automate a canary analysis and deployment of an application with Spinnaker canary analysis, Prometheus metrics, and HashiCorp Consul service mesh. Spinnaker, a continuous delivery framework, can control an application’s rollout based on the error rate reported by the service mesh’s proxies. While this example uses Kubernetes and Spinnaker, you can apply a similar approach to other workload orchestrators and continuous delivery platforms as long as you can configure Consul and analyze metrics.
Note: The configurations in this post use Consul 1.9 and Spinnaker 1.24. Download the example code for detailed configuration.
Let’s examine an example of a successful canary deployment. In the short video below, the percentage of traffic to the canary version increments each time the analysis stages pass. After all of the stages pass and the canary serves 100% of the traffic, the pipeline sets a new baseline version based on the canary.
The next video reviews a failed canary deployment. Imagine you deploy a canary version of an application with a minor bug. The first canary stage sends only 10% of traffic to the application. It recognizes the increased error for the application during analysis. The pipeline mitigates the failed change by sending 100% of traffic back to the baseline version.
»Deploy Consul
You need to register your services to a service mesh before you release it using a canary deployment. You can use HashiCorp Consul to generate proxy metrics and Prometheus to collect them. Consul uses proxies to manage and shape traffic between services. The proxies can collect telemetry on requests to services. Review our tutorial on using Prometheus and Consul service mesh for a more detailed explanation of sending Consul’s proxy metrics to Prometheus.
The Consul Helm chart creates a Consul server, clients, controller, injector, and UI. The values.yaml required version 0.31.1 or higher of the Consul Helm chart. This chart version enables the metrics configuration and deploys Prometheus as part of the installation:
global:
 name: consul
 datacenter: kubernetes
 metrics:
   enabled: true

prometheus:
 enabled: true

server:
 replicas: 1

client:
 enabled: true

connectInject:
 enabled: true

controller:
 enabled: true
Note: This configuration does not set up Consul ACLs or a secure configuration on Kubernetes. For more detailed information, refer to our Learn tutorial.
Add the HashiCorp Helm chart repository:
$ helm repo add hashicorp https://helm.releases.hashicorp.com
Check the chart version is 0.31.1 or higher:
$ helm search repo hashicorp/consul

NAME                    CHART VERSION   APP VERSION     DESCRIPTION
hashicorp/consul        0.31.1          1.9.4           Official HashiCorp Consul Chart
Run Helm to install the Consul cluster and Prometheus server:
$ helm install consul hashicorp/consul -f values.yaml
After you deploy Consul to the cluster, you can access the Consul UI locally on http://localhost:8500 with Kubernetes port forwarding:
$ kubectl port-forward svc/consul-ui 8500:80
To add the dashboards for request metrics, install the Grafana Helm chart:
$ helm repo add grafana https://grafana.github.io/helm-charts
Deploy Grafana using the Helm values for this example. They include a pre-fabricated dashboard that will be loaded into Grafana:
adminPassword: password

datasources:
 datasources.yaml:
   apiVersion: 1
   datasources:
   - name: Prometheus
     type: prometheus
     url: http://prometheus-server
     access: proxy
     isDefault: true

dashboardProviders:
dashboardproviders.yaml:
  apiVersion: 1
  providers:
  - name: 'default'
    orgId: 1
    folder: ''
    type: file
    disableDeletion: false
    editable: true
    options:
      path: /var/lib/grafana/dashboards/default

dashboards:
 default:
   app:
     json: |
       {
         "annotations": {
         # omitted for clarity
After you deploy Grafana to the cluster, you can access the Grafana dashboard locally on http://localhost:3000 with Kubernetes port forwarding. Log in with the username admin and the password password:
$ kubectl port-forward svc/grafana 3000:80
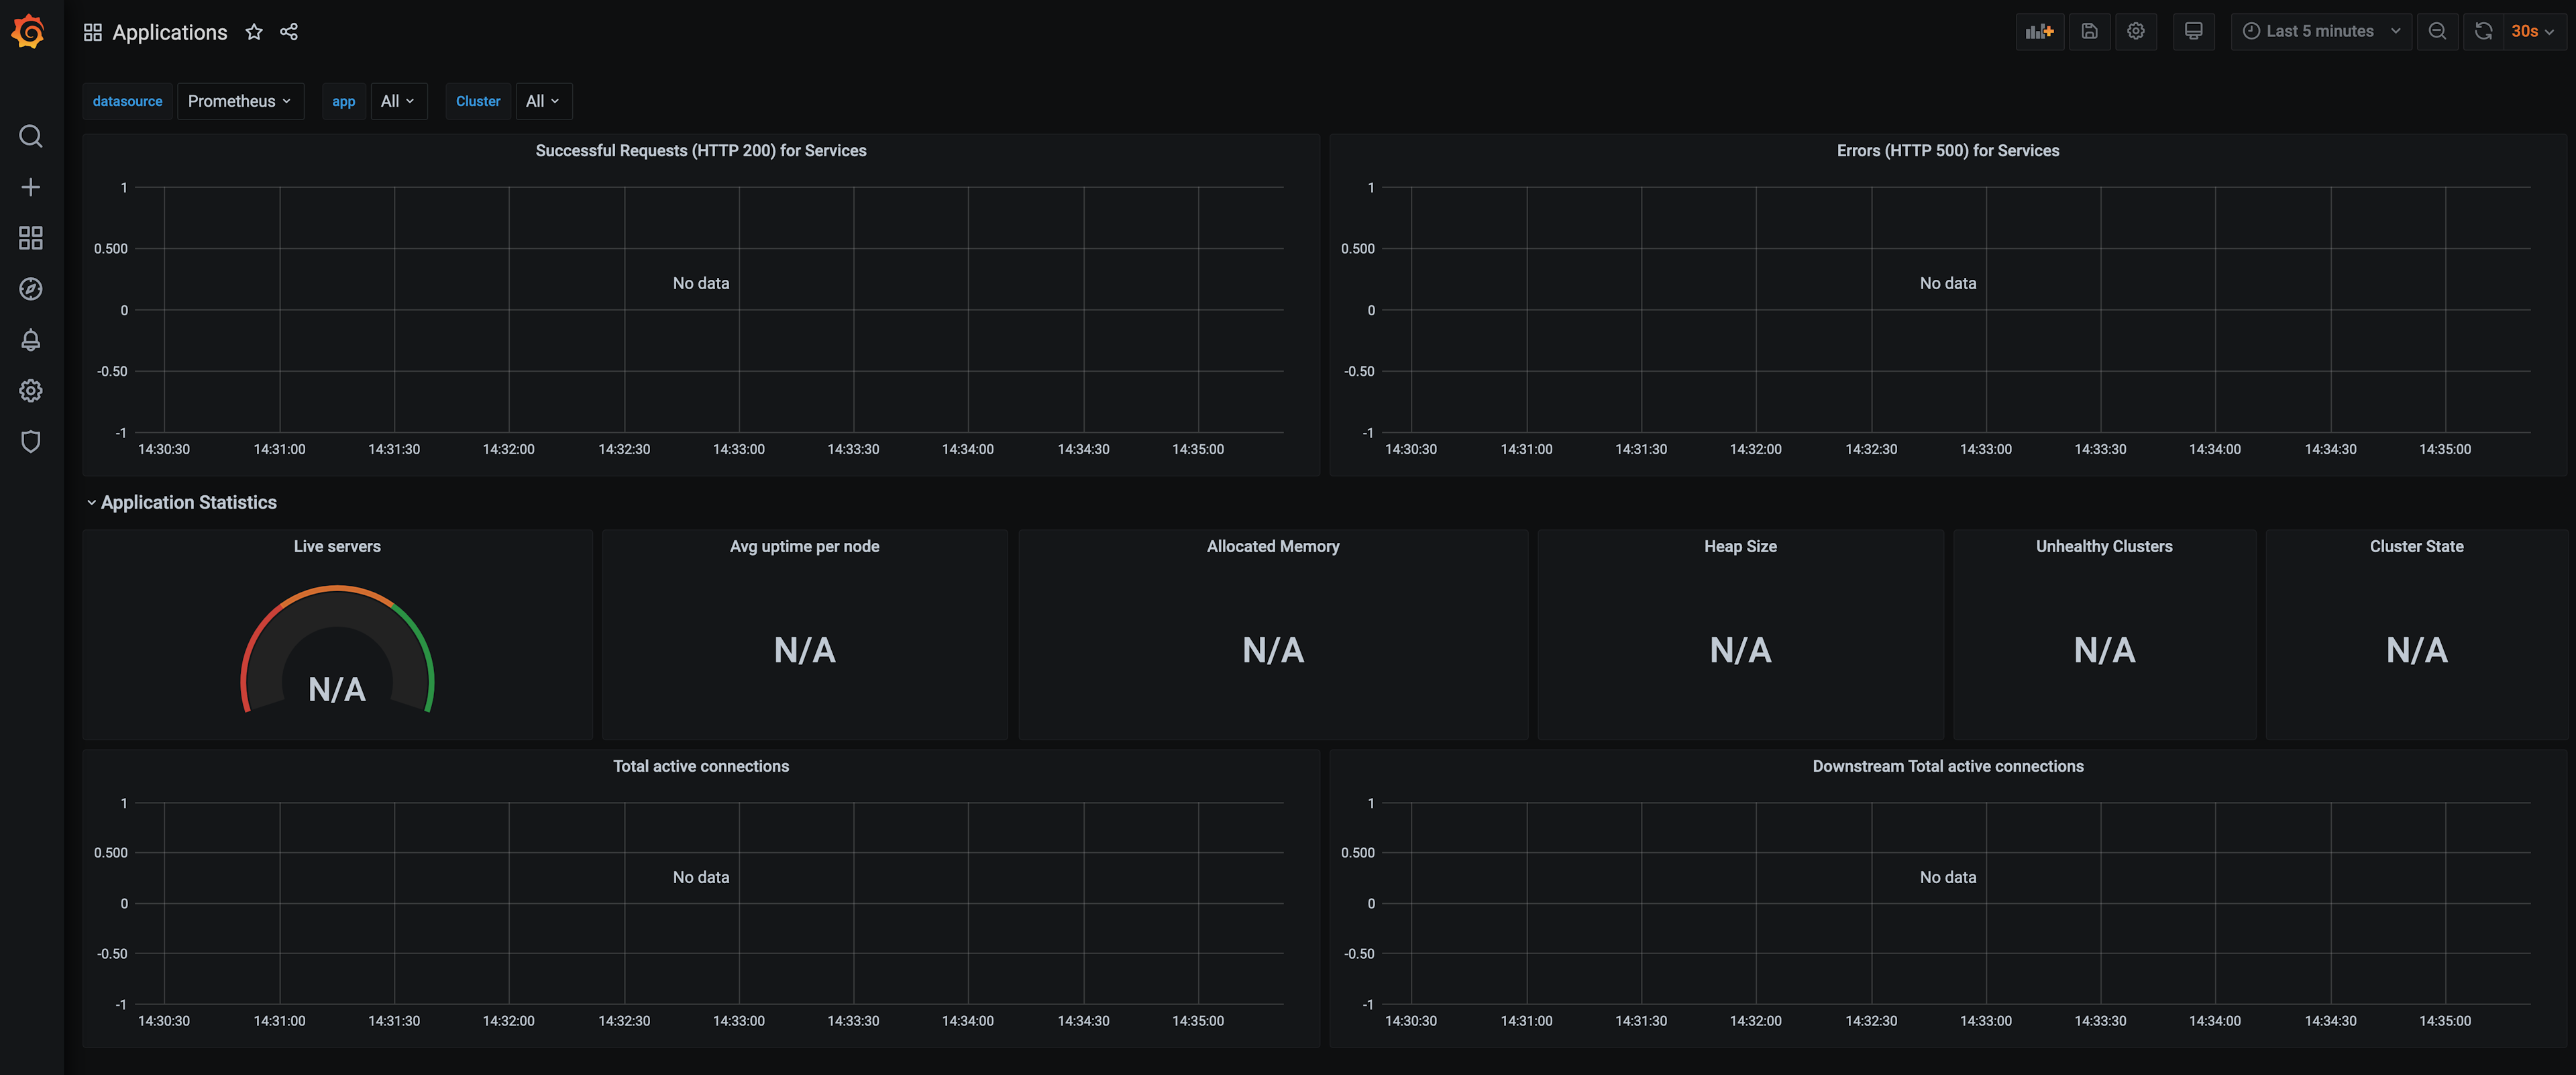
You’ll find a dashboard named “Applications” that will eventually display request metrics for Consul services:
Before you deploy the example application, set the default configuration for Consul’s proxies. You can use Kubernetes CustomResourceDefinitions for proxy defaults. The proxies use http as the default protocol and write metrics to Prometheus. Save this file as proxydefaults.yaml:
apiVersion: consul.hashicorp.com/v1alpha1
kind: ProxyDefaults
metadata:
  name: global
spec:
  config:
    protocol: http
    envoy_prometheus_bind_addr: "0.0.0.0:9102"'
Apply proxydefaults.yaml to your Kubernetes cluster:
$ kubectl apply -f proxydefaults.yaml
»Deploy Example Applications
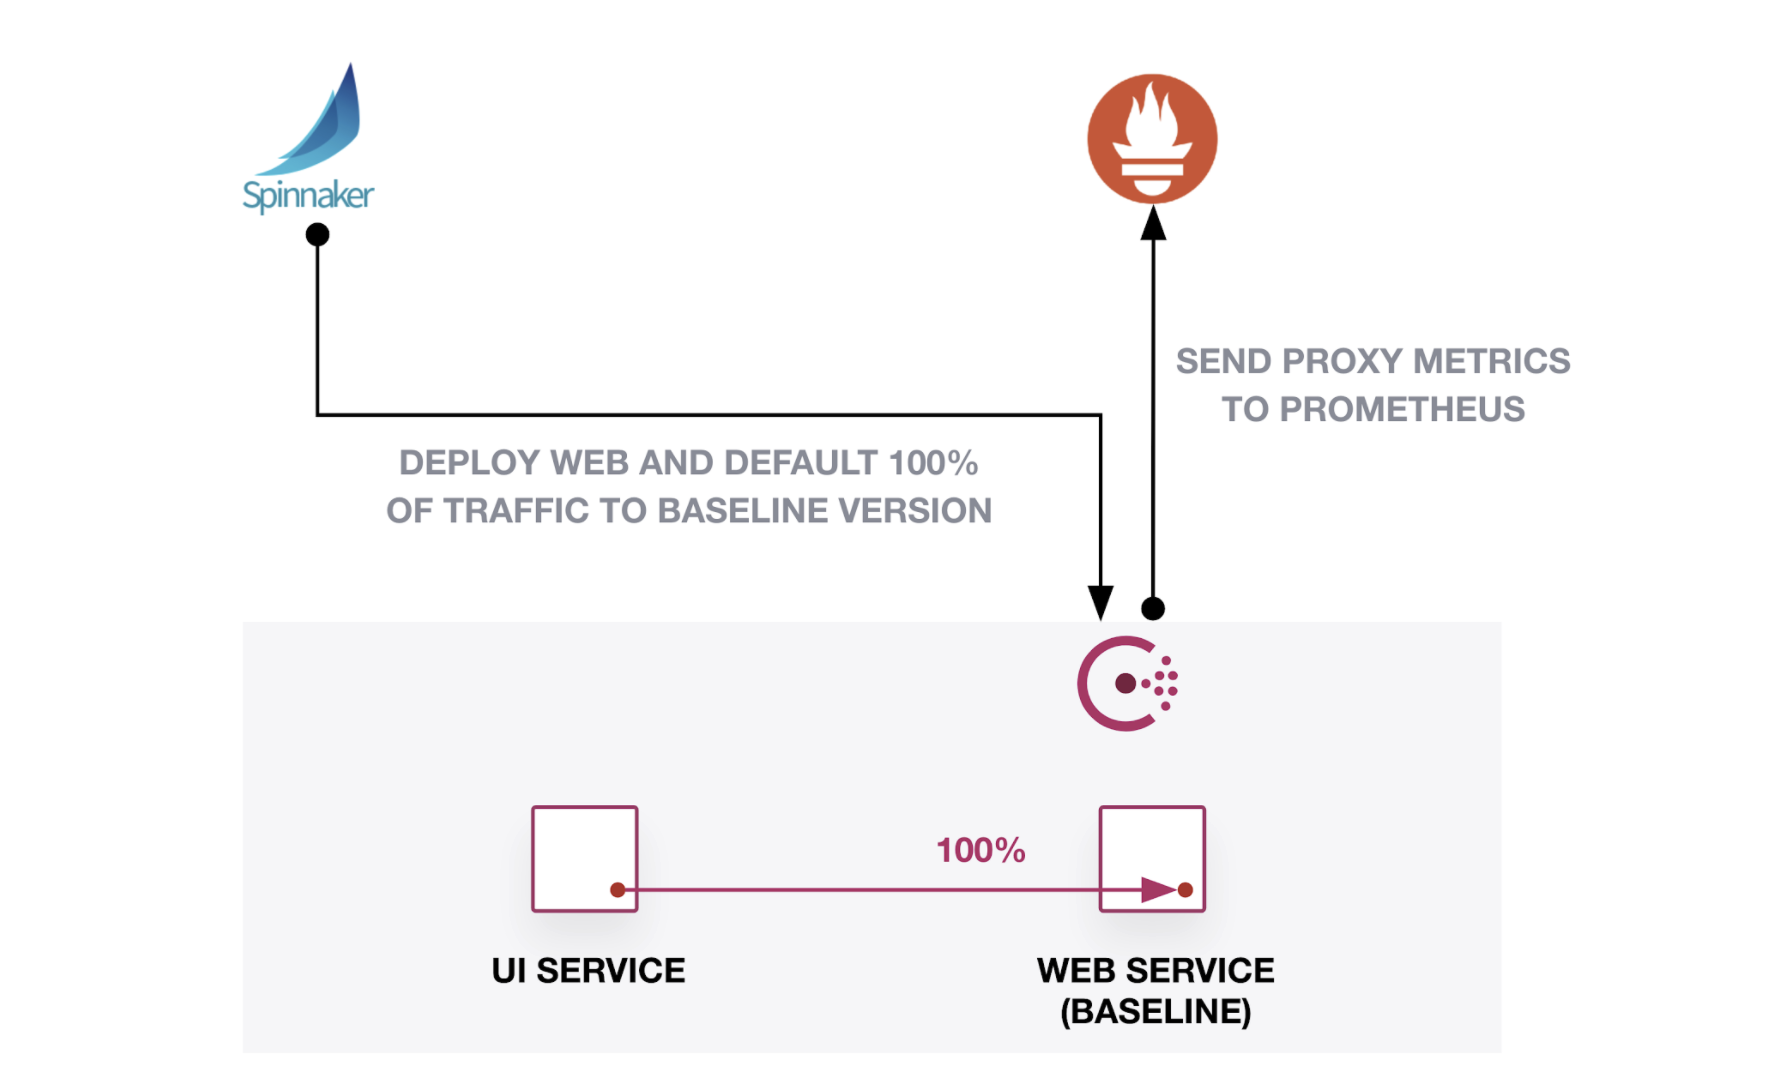
This demonstration uses two services named “ui” and “web”. Both services use Consul service mesh. All traffic from the “ui” service goes to the baseline version of “web”. The proxies for each service collect metrics for requests and responses without additional telemetry added to the application code.
You can find the manifests for the applications in this post within the example code. After you deploy the services, access the “ui” service through its Kubernetes load balancer configuration on port 9090:
$ kubectl get services ui --output jsonpath='{.status.loadBalancer.ingress[0].ip}'
You can also use the Consul UI’s topology view to verify that “ui” connects to the “web” service:

Now that you’ve deployed a baseline, release a new version of the “web” service. Call it the “canary” release. You’ll use a canary deployment to send a small percentage of traffic to the canary release, analyze for any errors, and continue the rollout if requests succeed. You can configure Spinnaker to retrieve the proxy metrics for successful requests and errors to the “web” service and monitor the status of the canary.
»Deploy Spinnaker
Spinnaker uses a command-line tool called Halyard for deployment and configuration. The example configures a Spinnaker instance to target a Kubernetes cluster and use Minio as the storage service. You can choose your own target platform and storage source for your Spinnaker instance.
In Spinnaker, enable canary analysis support for Prometheus:
# May be optional depending on your Spinnaker version

$ hal config features edit --mine-canary true

$ hal config canary prometheus enable
The canary account in Spinnaker must reference the Prometheus server and store analysis data into Minio. Set the MINIO_SECRET_KEY, MINIO_ACCESS_KEY, and ENDPOINT environment variables based on your Minio deployment:
$ export MINIO_ACCESS_KEY=$(kubectl get -n storage secret s3-storage -o jsonpath="{.data.accesskey}" | base64 --decode)

$ export MINIO_SECRET_KEY=$(kubectl get -n storage secret s3-storage -o jsonpath="{.data.secretkey}" | base64 --decode)

$ export ENDPOINT=http://s3-storage.storage.svc.cluster.local:9000
Configure the default metrics store and account for canary analysis:
$ hal config canary prometheus account edit metrics \
--base-url http://loki-prometheus-server.default.svc.cluster.local

$ echo $MINIO_SECRET_KEY | hal config canary aws account \
edit minio --bucket spin-bucket --endpoint $ENDPOINT \
--access-key-id $MINIO_ACCESS_KEY --secret-access-key

$ hal config canary aws edit --s3-enabled=true

$ hal config canary edit --default-metrics-store prometheus

$ hal config canary edit --default-metrics-account metrics

$ hal config canary edit --default-storage-account minio
Deploy Spinnaker on your Kubernetes cluster. It will take some time to create the components in the spinnaker namespace:
$ hal deploy apply

...
+ Deploy spin-rosco  Success
+ Run `hal deploy connect` to connect to Spinnaker.
Connect to Spinnaker on Kubernetes. Spinnaker exposes its UI on port 9000 and API on 8084. Keep this terminal session open to configure your Spinnaker pipelines:
$ hal deploy connect

+ Get current deployment
  Success
+ Connect to Spinnaker deployment.
  Success
Forwarding from 127.0.0.1:9000 -> 9000
Forwarding from [::1]:9000 -> 9000
Forwarding from 127.0.0.1:8084 -> 8084
Forwarding from [::1]:8084 -> 8084
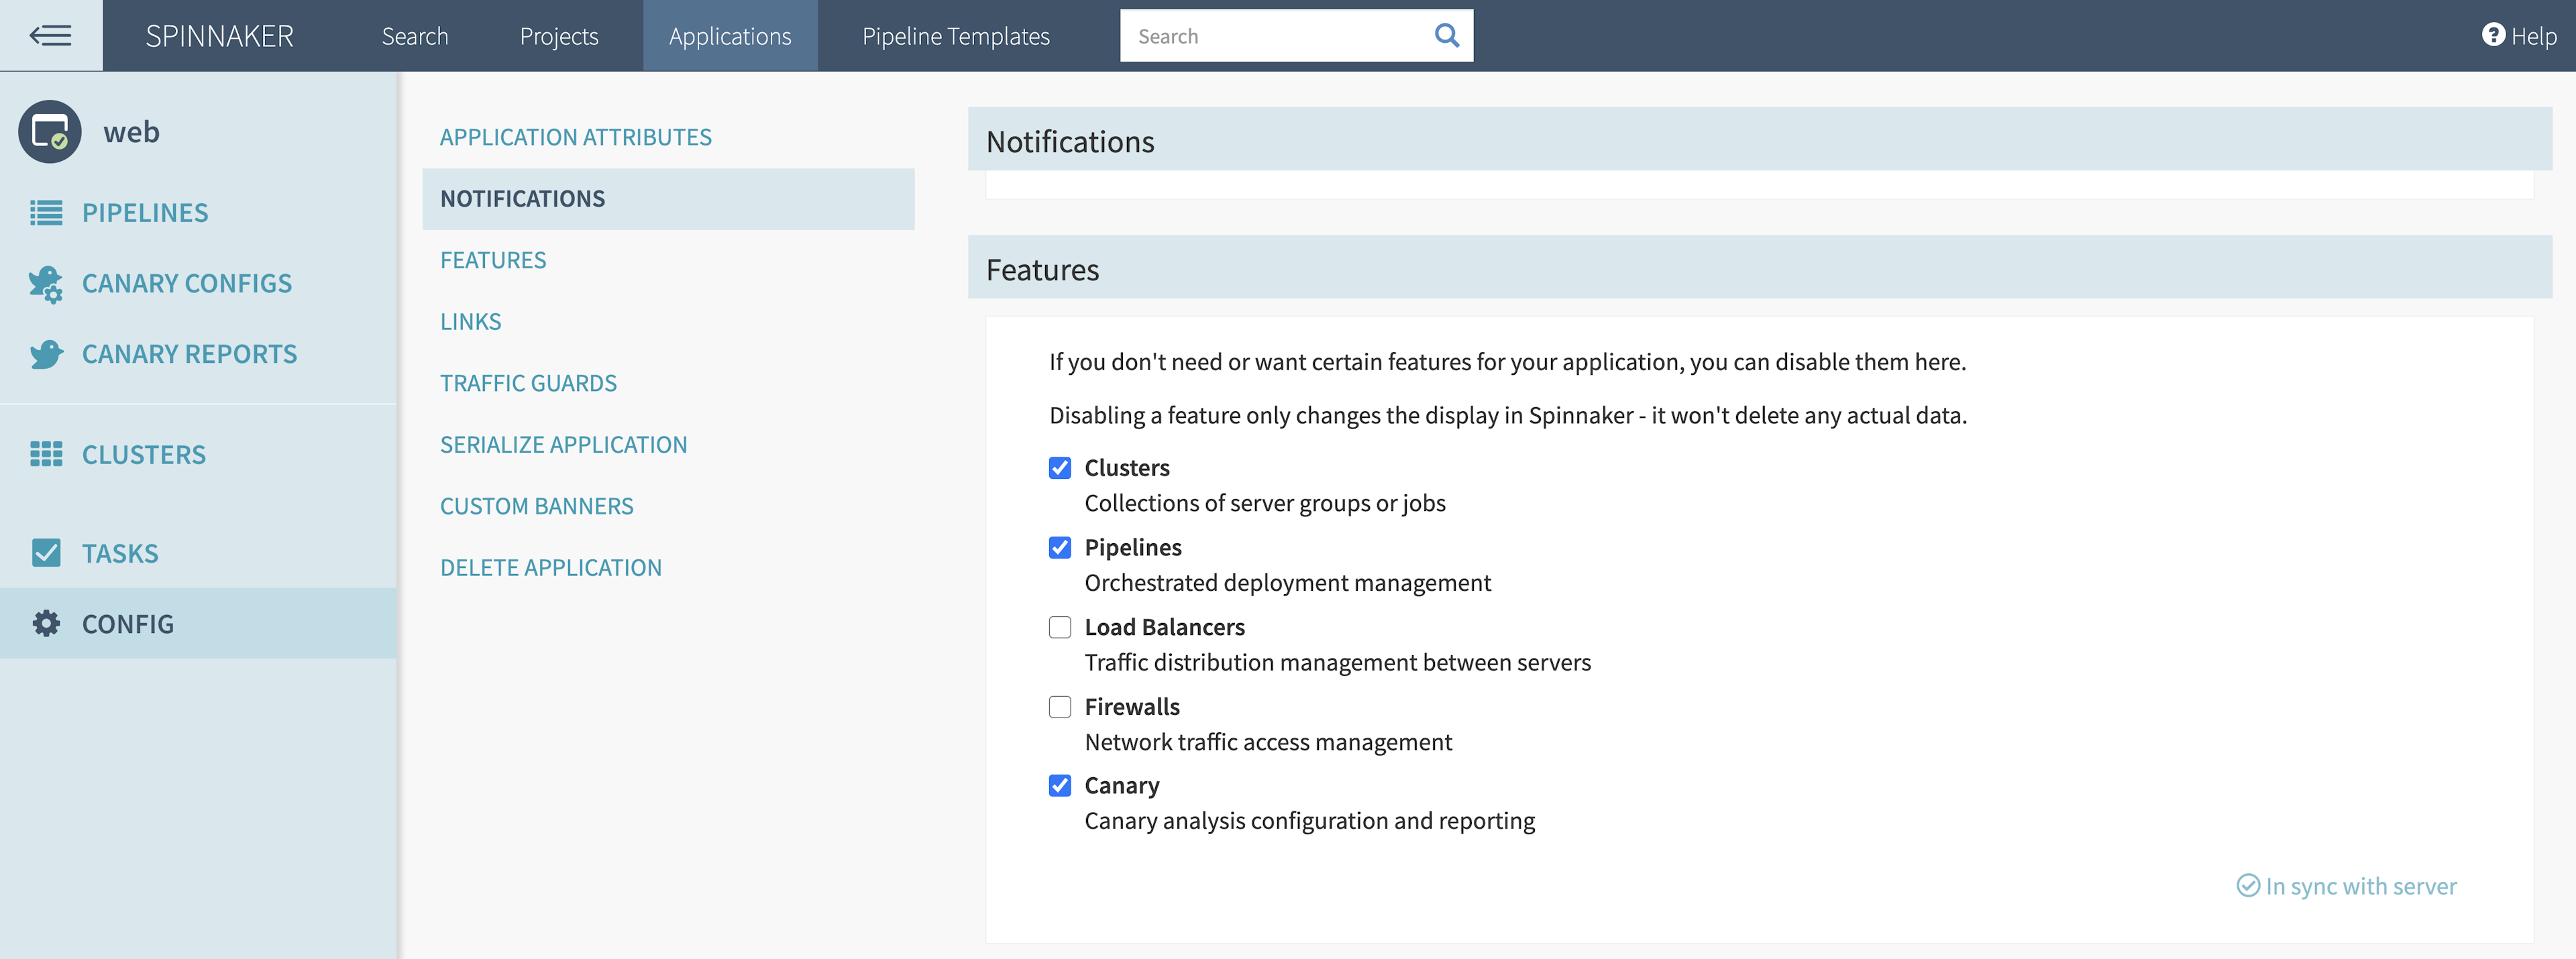
Spinnaker uses Kayenta to analyze metrics for canary deployments. You must enable the “Canary” setting under each Spinnaker application’s configuration to use the feature.
Initialize the Spinnaker application and canary configuration using the spin command-line interface. Make sure you can access the Spinnaker API on http://localhost:8084 and download the example repository.
Create the Spinnaker application named “web”. This groups any pipelines related to a particular application:
$ spin application save -f spinnaker/application.json
Apply the Spinnaker canary configuration to the “web” application. This already includes the metrics and analysis configuration for the “web” canary release:
$ spin canary canary-config save --file spinnaker/canary-config.json
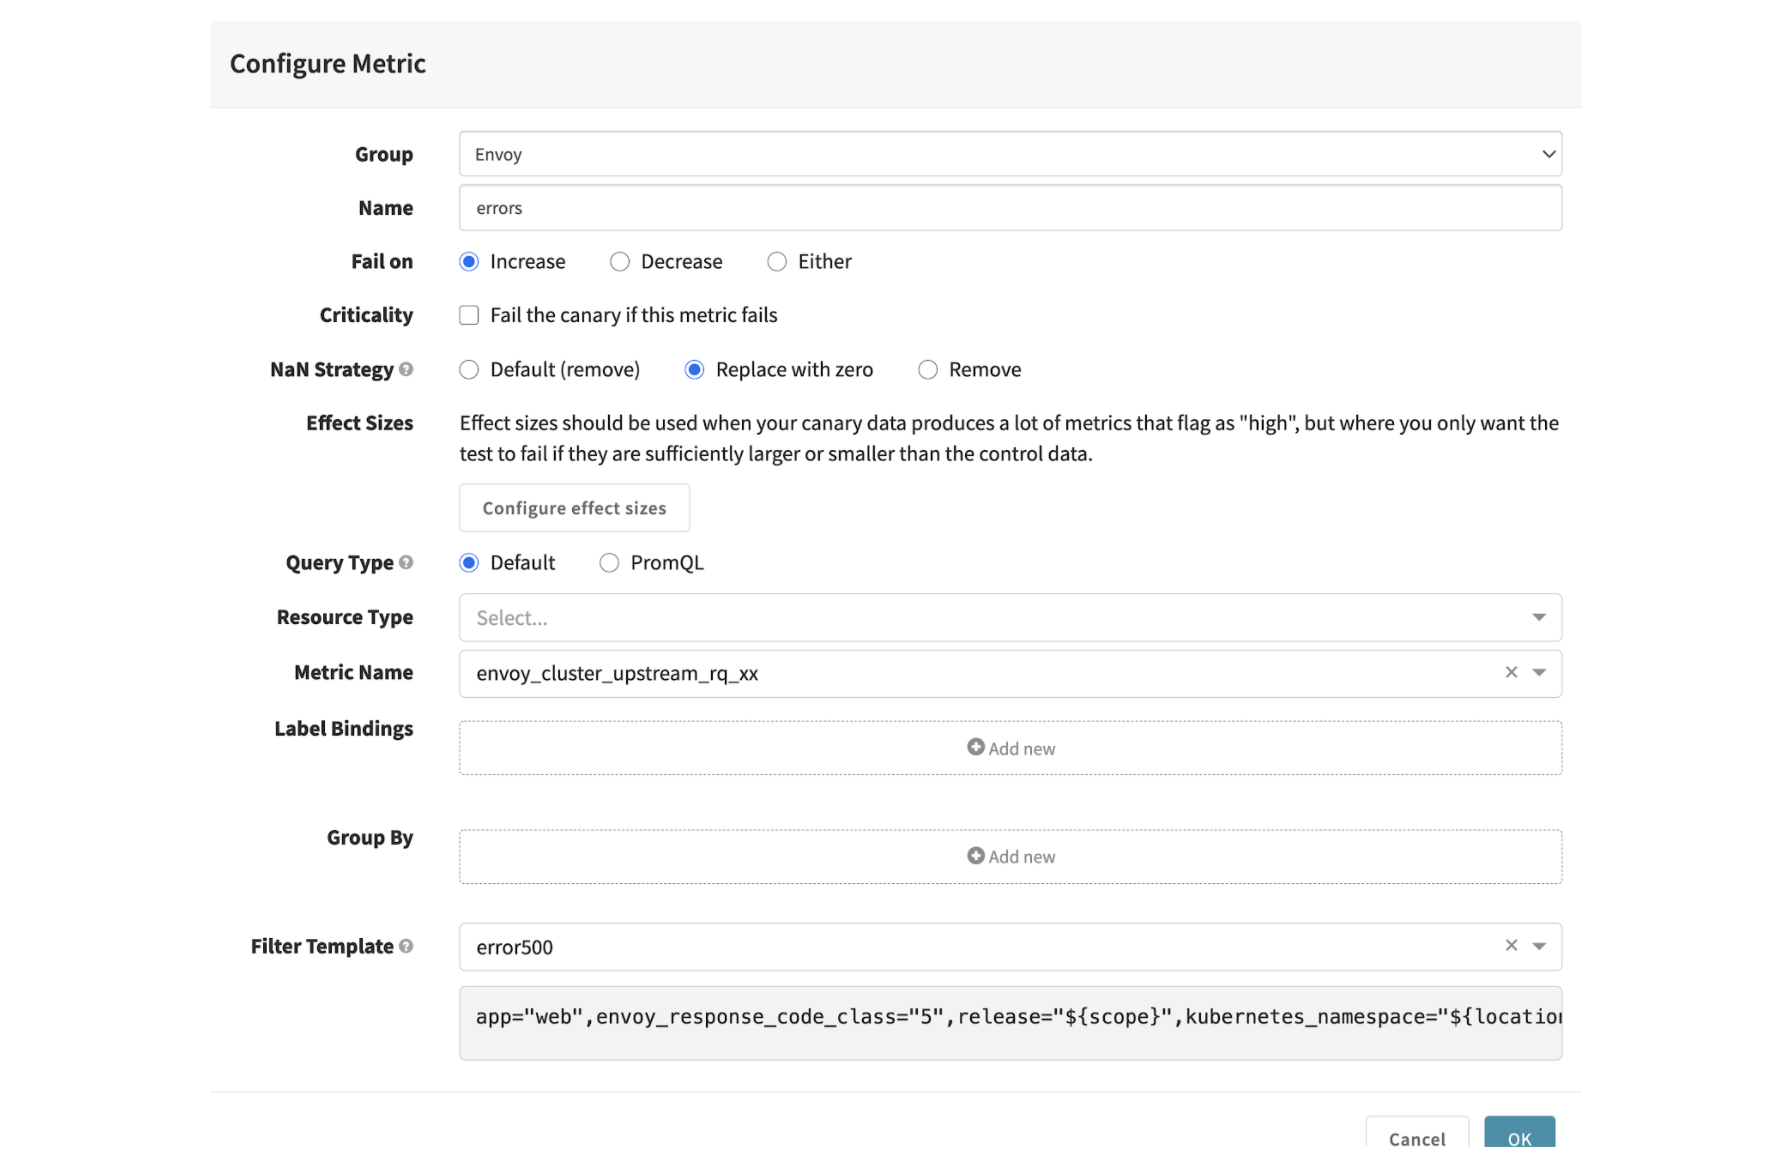
When you examine the canary configuration in the Spinnaker UI, you will notice that it analyzes Envoy metrics from the “web” service:
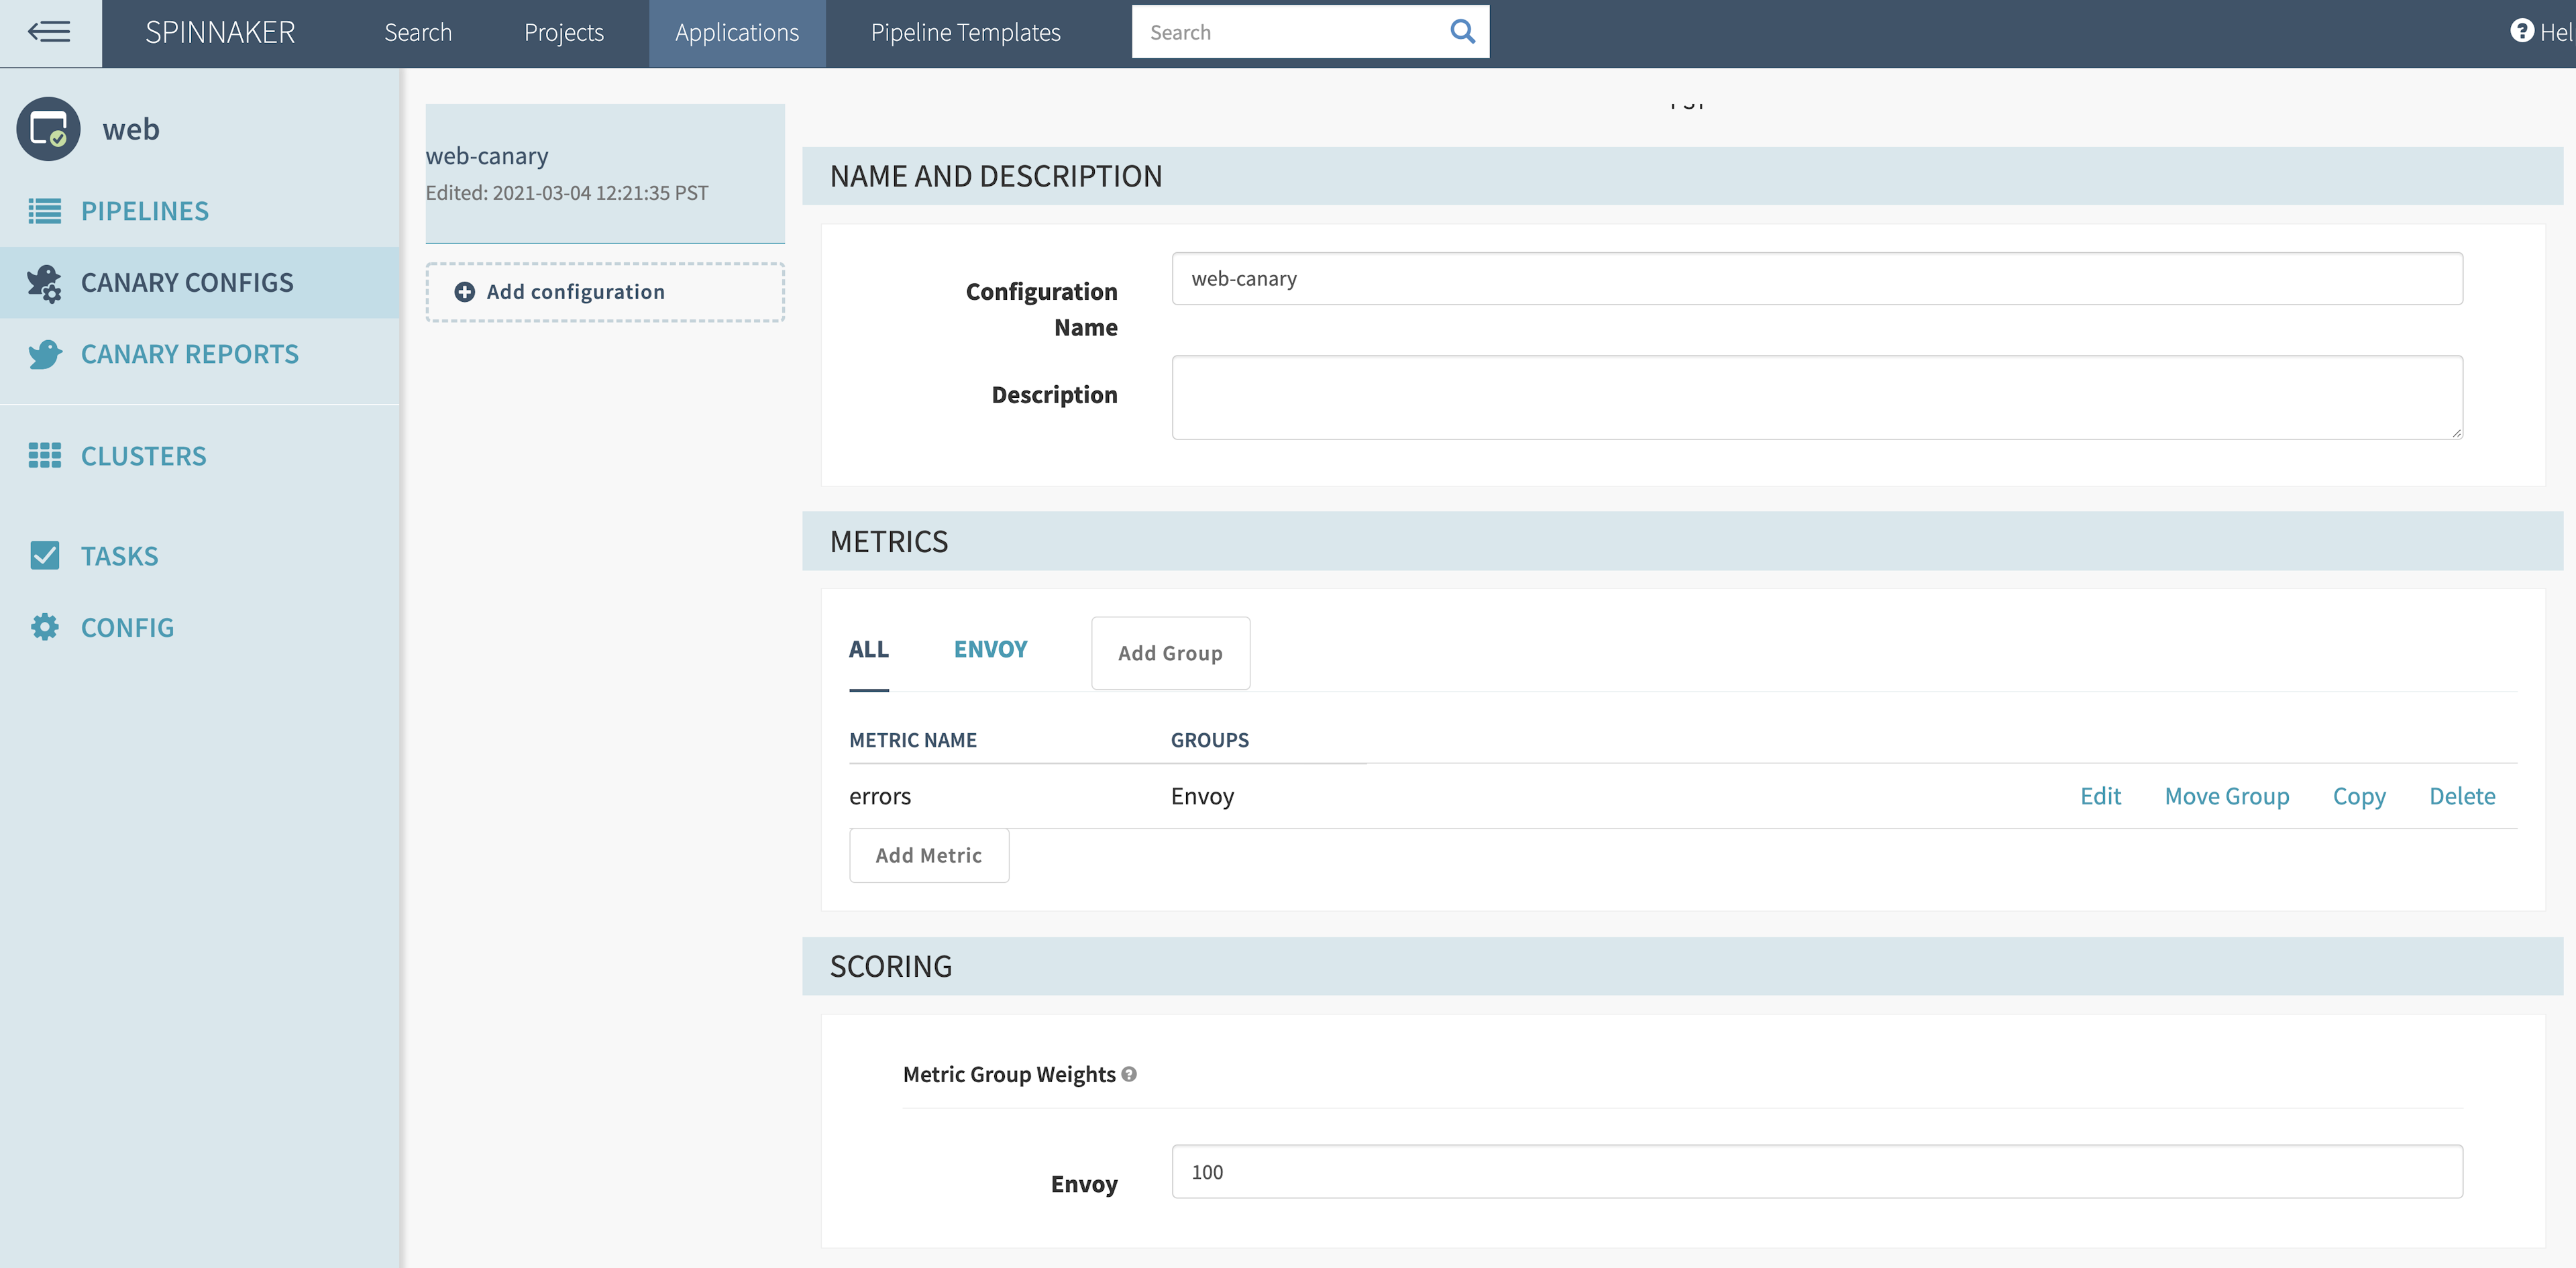
The canary metric group analyzes the envoy_cluster_upstream_rq_xx metric from Prometheus. This metric counts the number of requests to the service and organizes them based on response code. For this example, you want to analyze requests from upstream for any HTTP 5XX response code, noted by the metric attribute envoy_response_code_class=”5”.
Use a filter template to select only metrics based on the “web” service, its release (defined by Spinnaker scope), and Kubernetes namespace (defined by Spinnaker location). By mapping the release to scope and namespace to location, you can pass attributes from the Spinnaker pipeline stage to the filter template:
app="web",envoy_response_code_class="5",release="${scope}",kubernetes_namespace="${location}"
If the metric increases over a pipeline’s analysis period, it will contribute to the overall score to determine if the canary deployment can continue. For “NaN Strategy”, choose “Replace with zero” to replace null data points with zero. You need to do this because envoy_cluster_upstream_rq_xx defaults to no data until the proxy receives a specific HTTP response code class:
The example uses a single metric to score the canary deployment. You can add more metrics for analysis and change the weight of each metric group under “Scoring”.
»Configure Spinnaker Pipeline
You’ll create a Spinnaker pipeline that uses a side-by-side canary deployment. This deploys a new version of the service and gradually cuts over traffic from baseline to canary version. You can also use Spinnaker for a rolling canary deployment, which scales up and down the individual service instances.
Create the pipelines for deploying and deleting the “web” service with the spin CLI. Make sure you can access the Spinnaker API on http://localhost:8084 and download the example repository:
$ spin pipeline save -f spinnaker/deploy.json

$ spin pipeline save -f spinnaker/delete.json
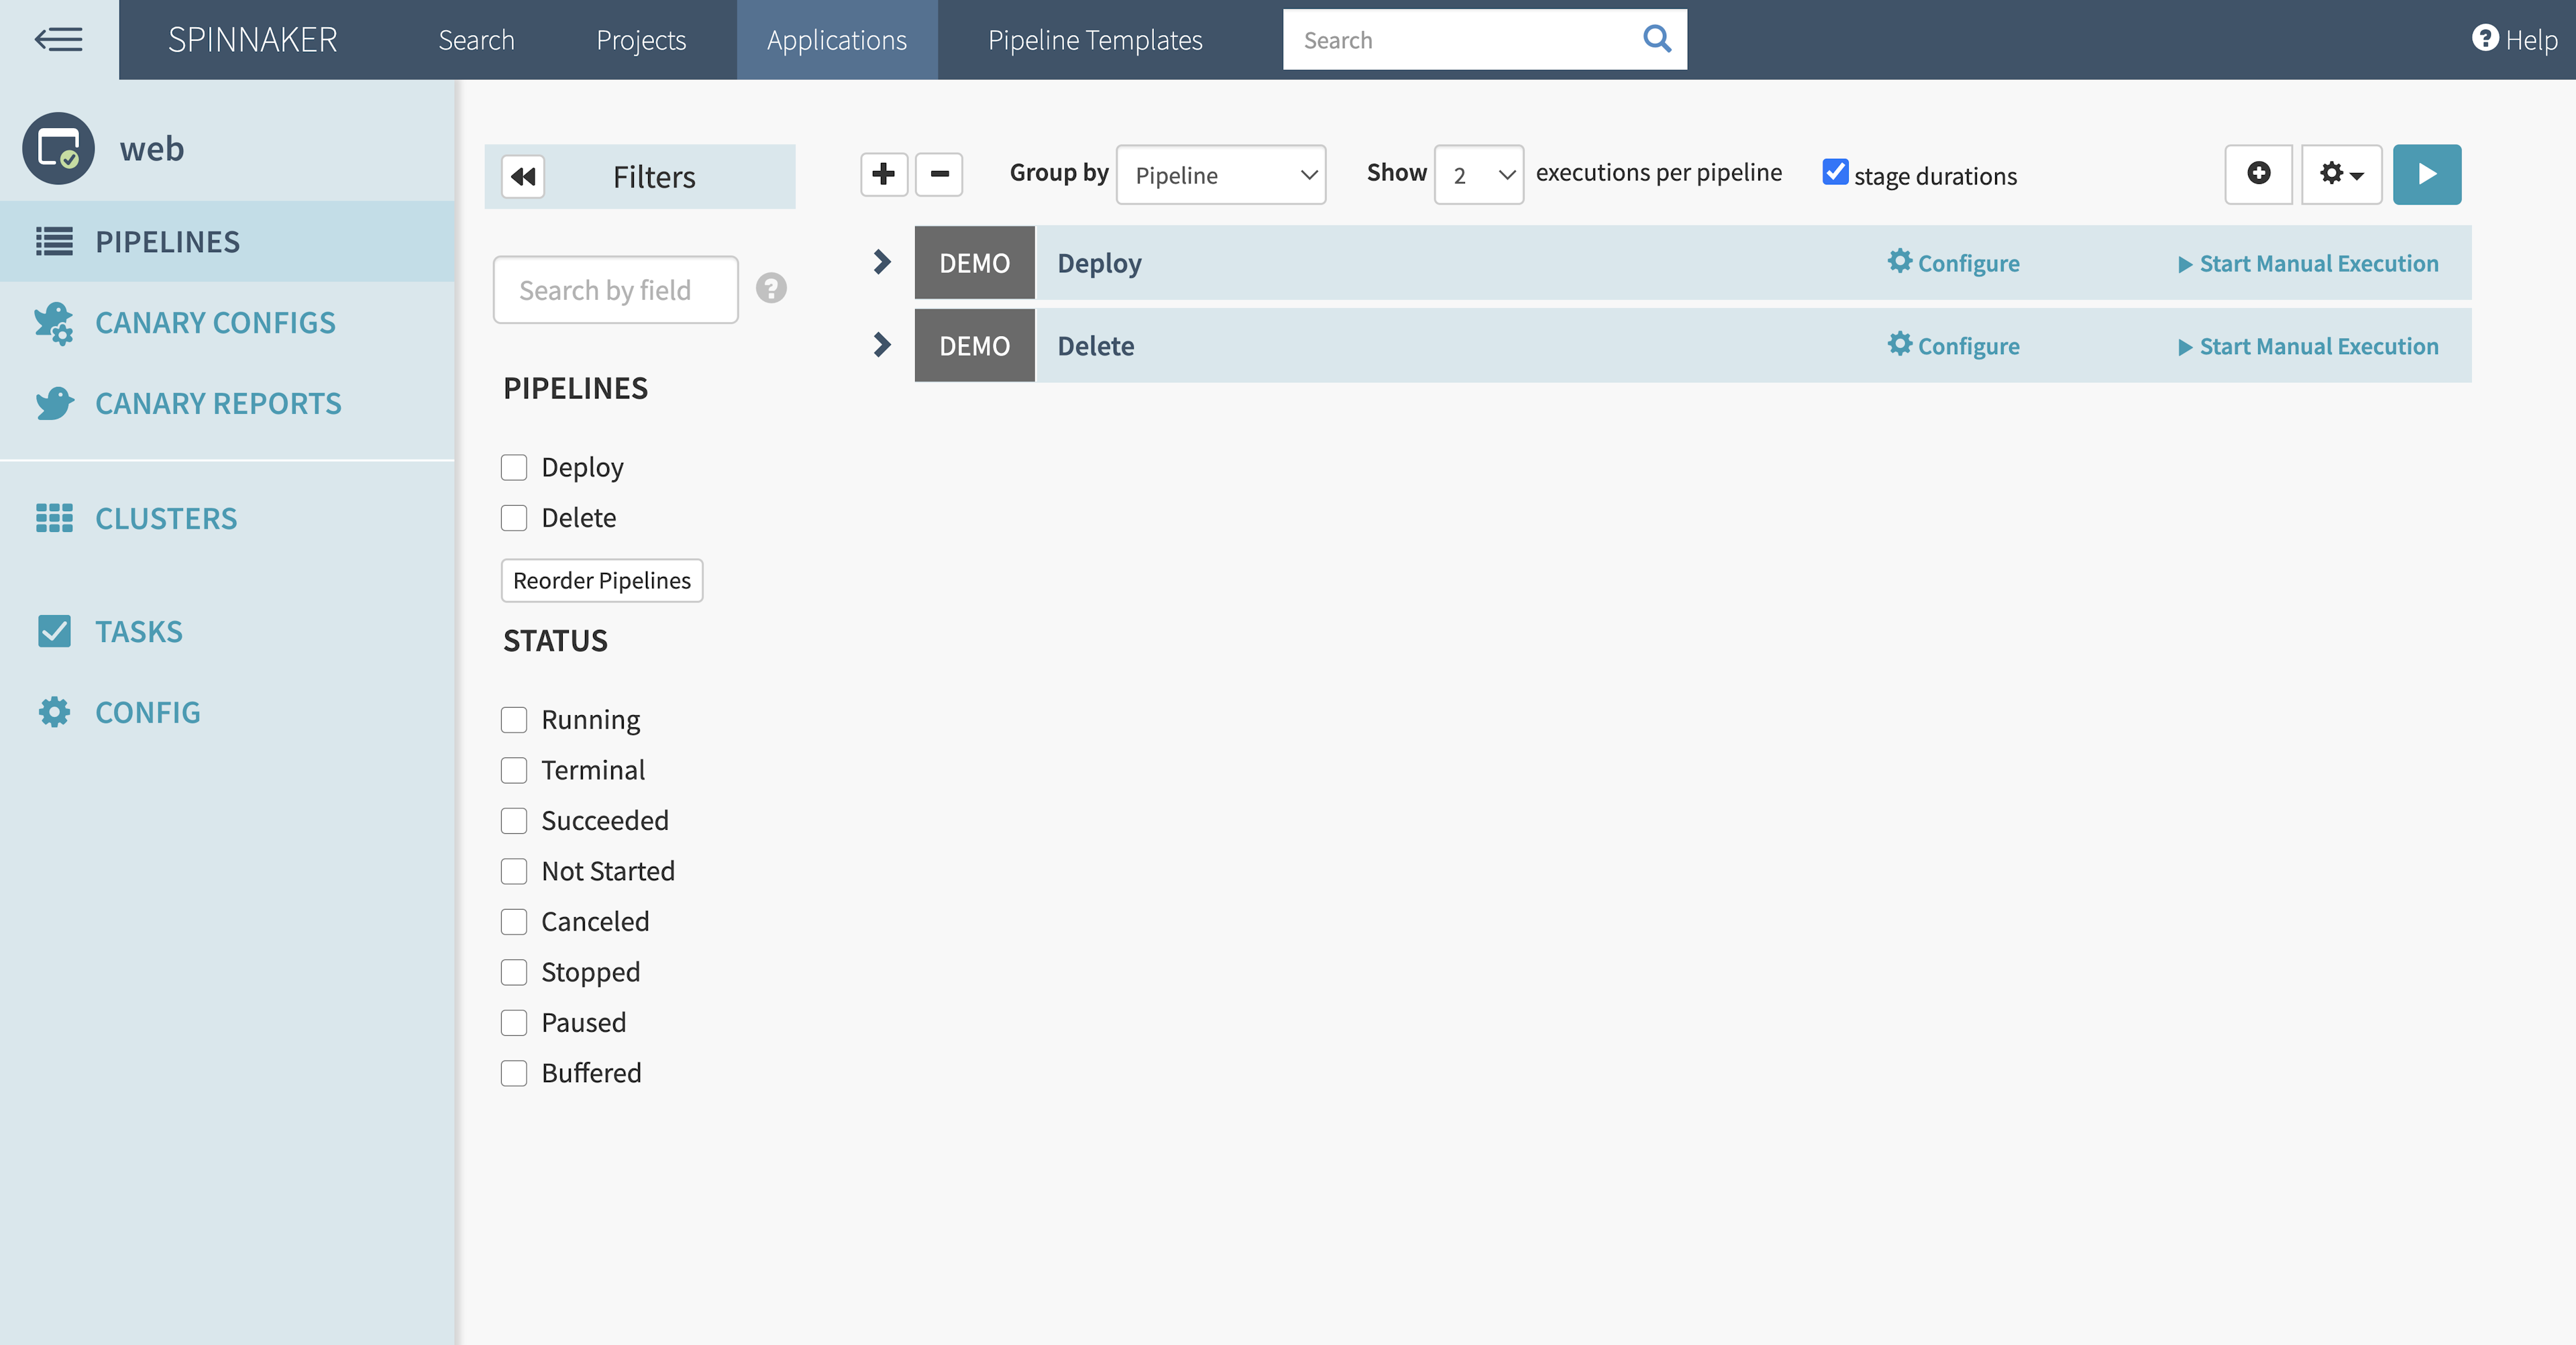
Spinnaker will have two pipelines, one to run the canary deployment for the “web” service and another to delete it.
Spinnaker will analyze Consul’s proxy metrics from Prometheus and generate a score during canary analysis stages. You set the canary configuration to watch for increases in the error rate to the “web” service. If the canary analysis passes, Spinnaker updates Consul to increase the percentage of the traffic to the canary release.
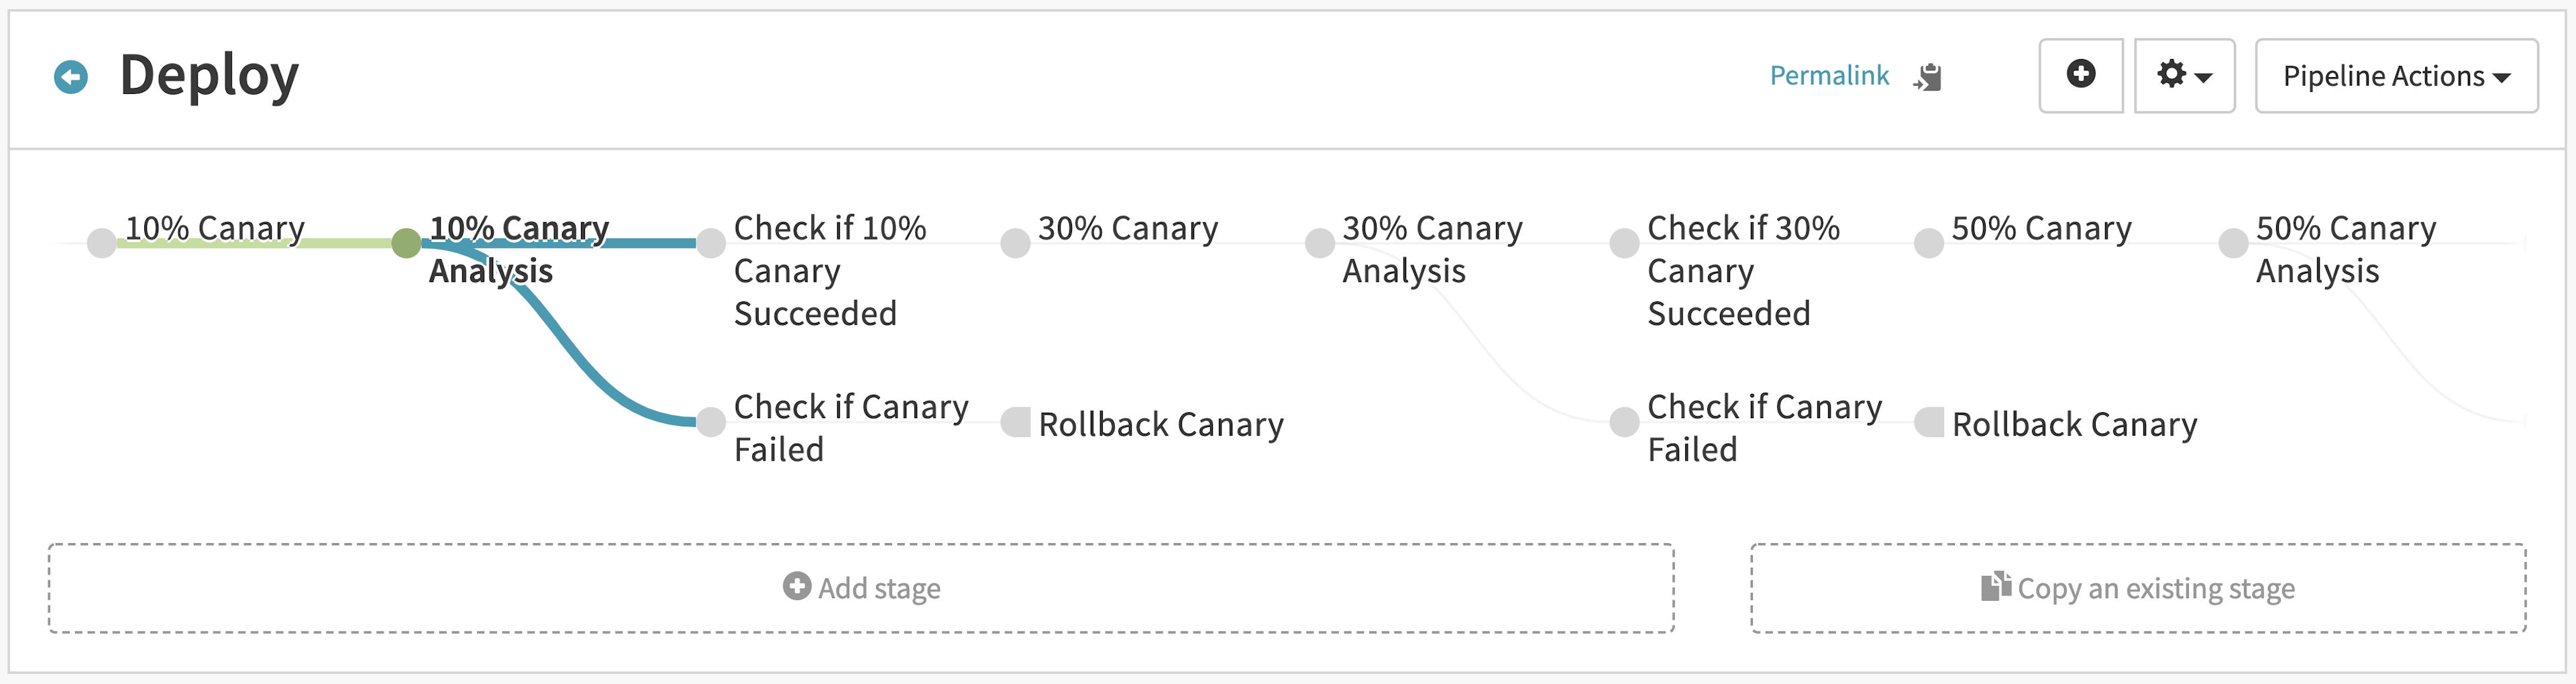
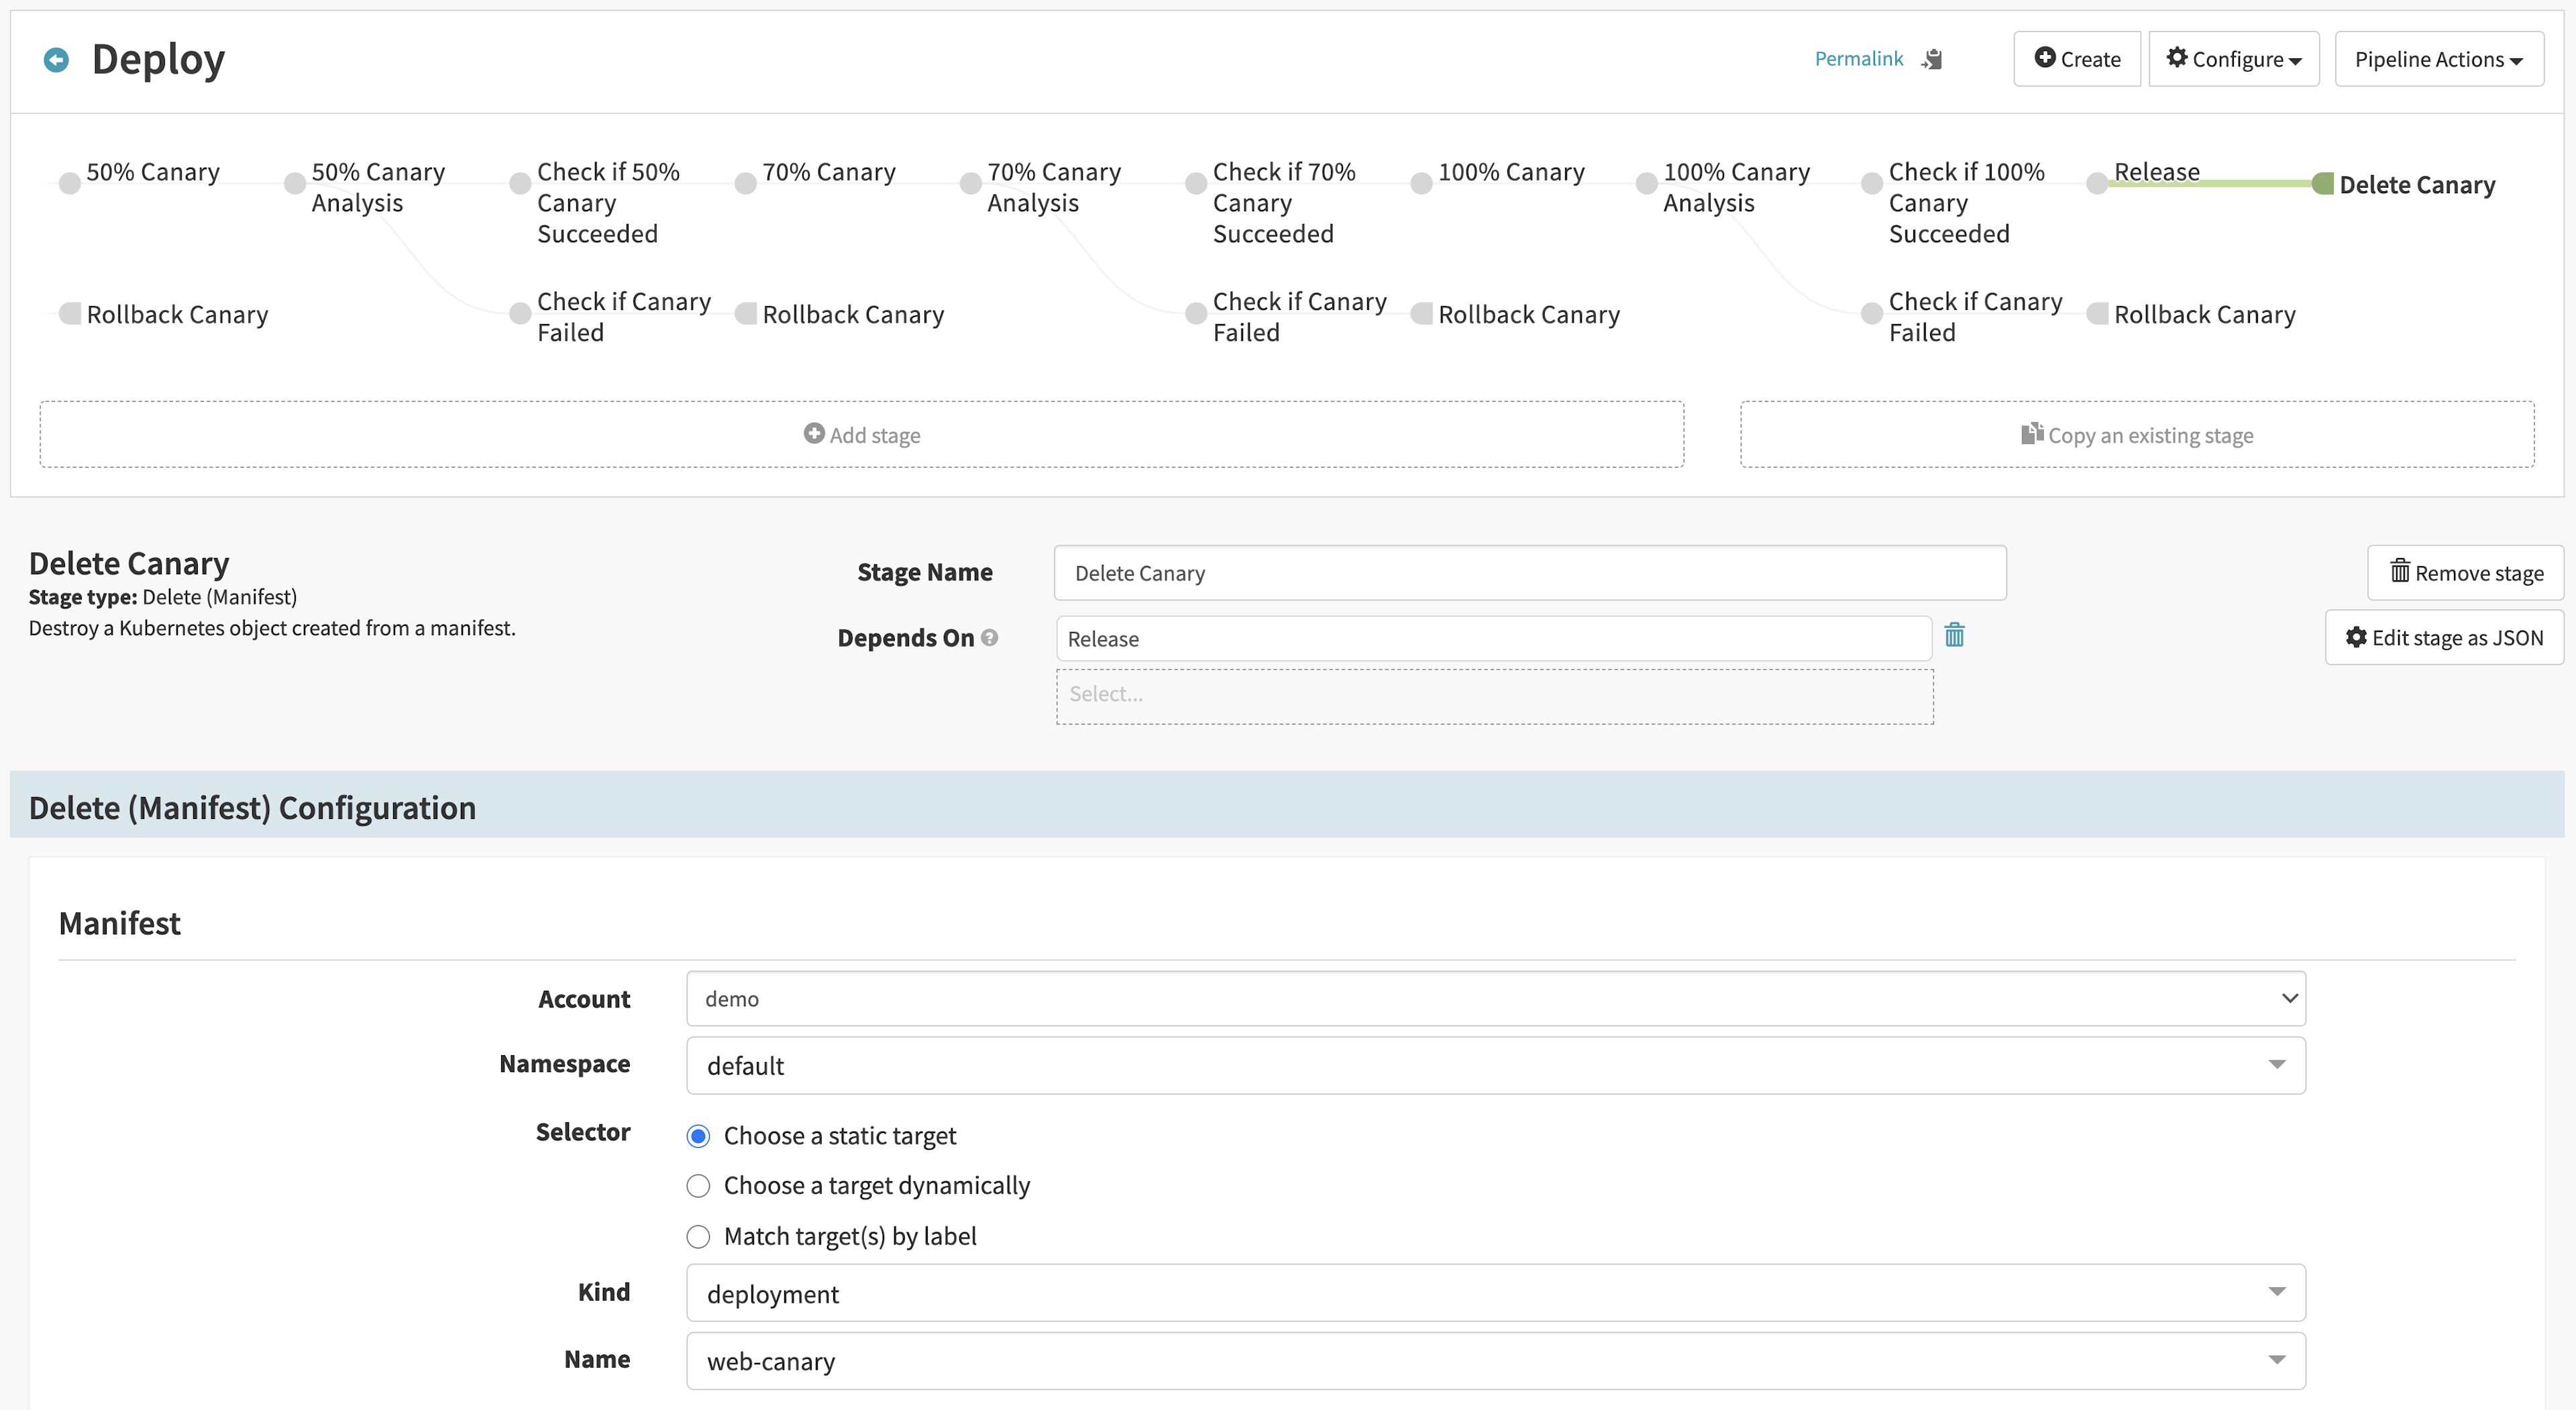
The “Deploy” pipeline contains alternating stages that analyze the canary, check the score, and increase the traffic split. Each time the analysis passes, the pipeline increases traffic to the canary version. If the analysis fails, it rolls back the deployment by resetting 100% of traffic to the baseline version and 0% to the canary version:
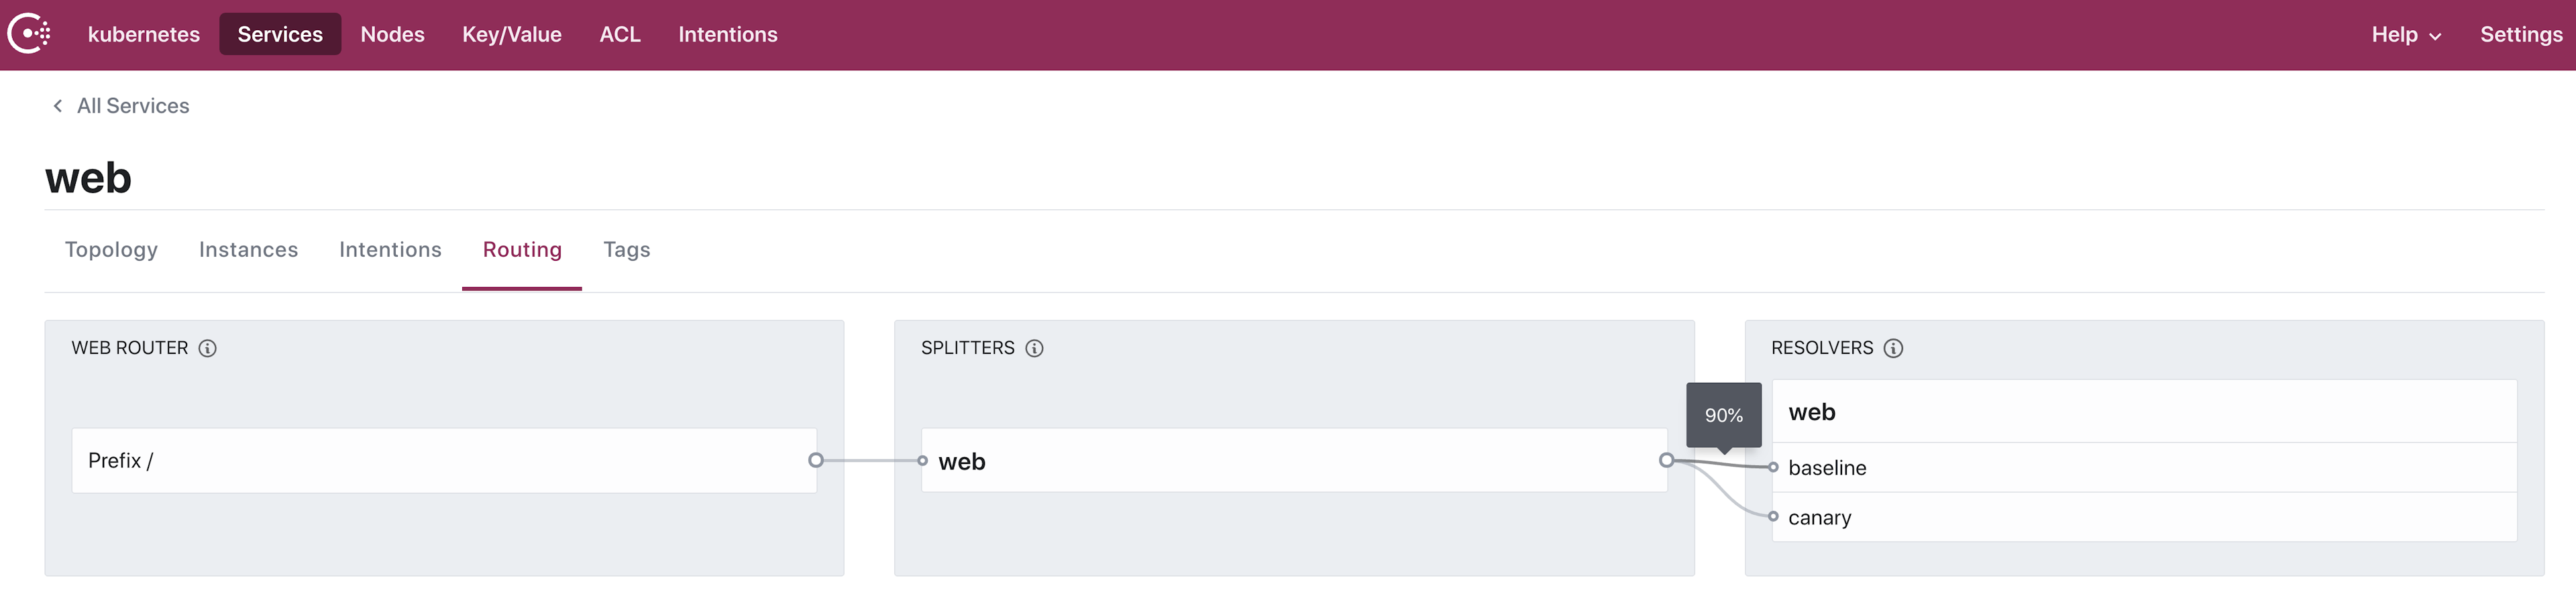
How does the pipeline control traffic splitting between the baseline and canary versions? Spinnaker updates the Consul service splitter to shape traffic between baseline and canary versions. During the canary stages, Spinnaker applies a pre-defined text manifest that updates the service weights. For example, the “10% Canary” stage updates the service splitter to send 90% of traffic to baseline and 10% to canary:
apiVersion: consul.hashicorp.com/v1alpha1
kind: ServiceSplitter
metadata:
  name: web
spec:
  splits:
    - serviceSubset: baseline
      weight: 90
    - serviceSubset: canary
      weight: 10
Note: This example statically defines the weights for each stage. You can reconfigure the pipeline as code to dynamically calculate and increase the
ServiceSplitterweights. Check out the documentation on Spinnaker pipeline templates and binding artifacts in Kubernetes manifests.
If you review the configuration in the Consul UI, the configuration reflects that 90% of traffic goes to the baseline version and 10% goes to canary:
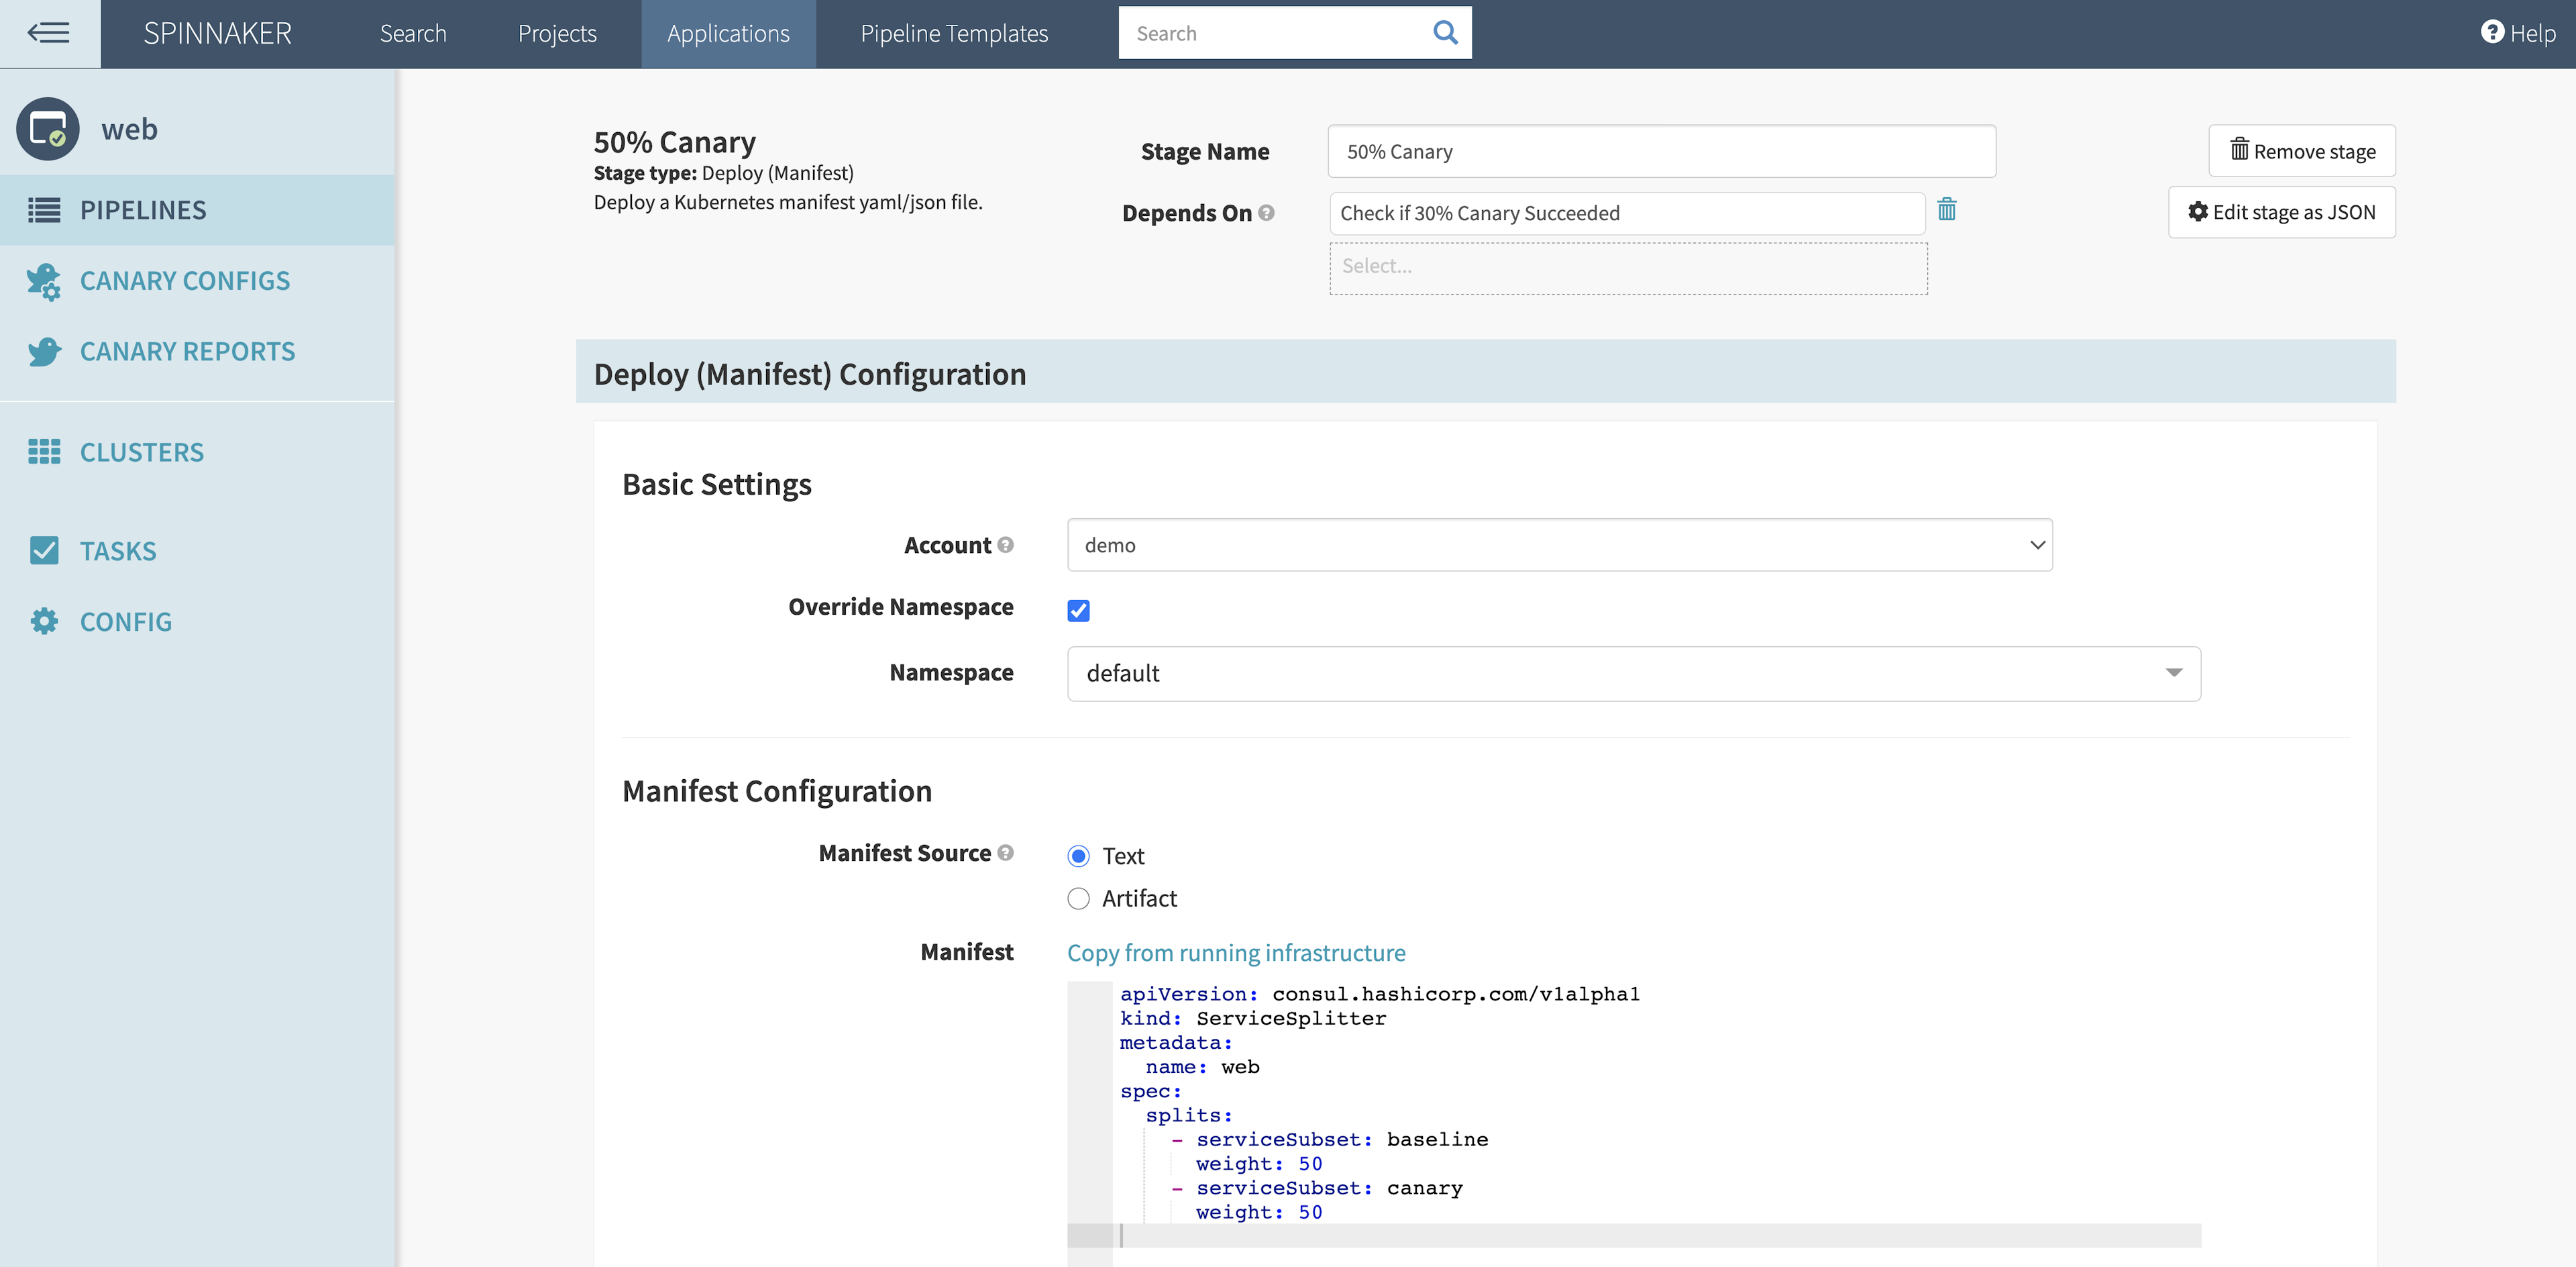
Each time the pipeline passes a canary analysis, it updates Consul’s service splitter to increase traffic to the canary version by 20%. For example, if the canary analysis succeeds with 30% of requests going to the canary version, Spinnaker changes the text manifest for the service splitter to 50%:
apiVersion: consul.hashicorp.com/v1alpha1
kind: ServiceSplitter
metadata:
  name: web
spec:
  splits:
    - serviceSubset: baseline
      weight: 50
    - serviceSubset: canary
      weight: 50
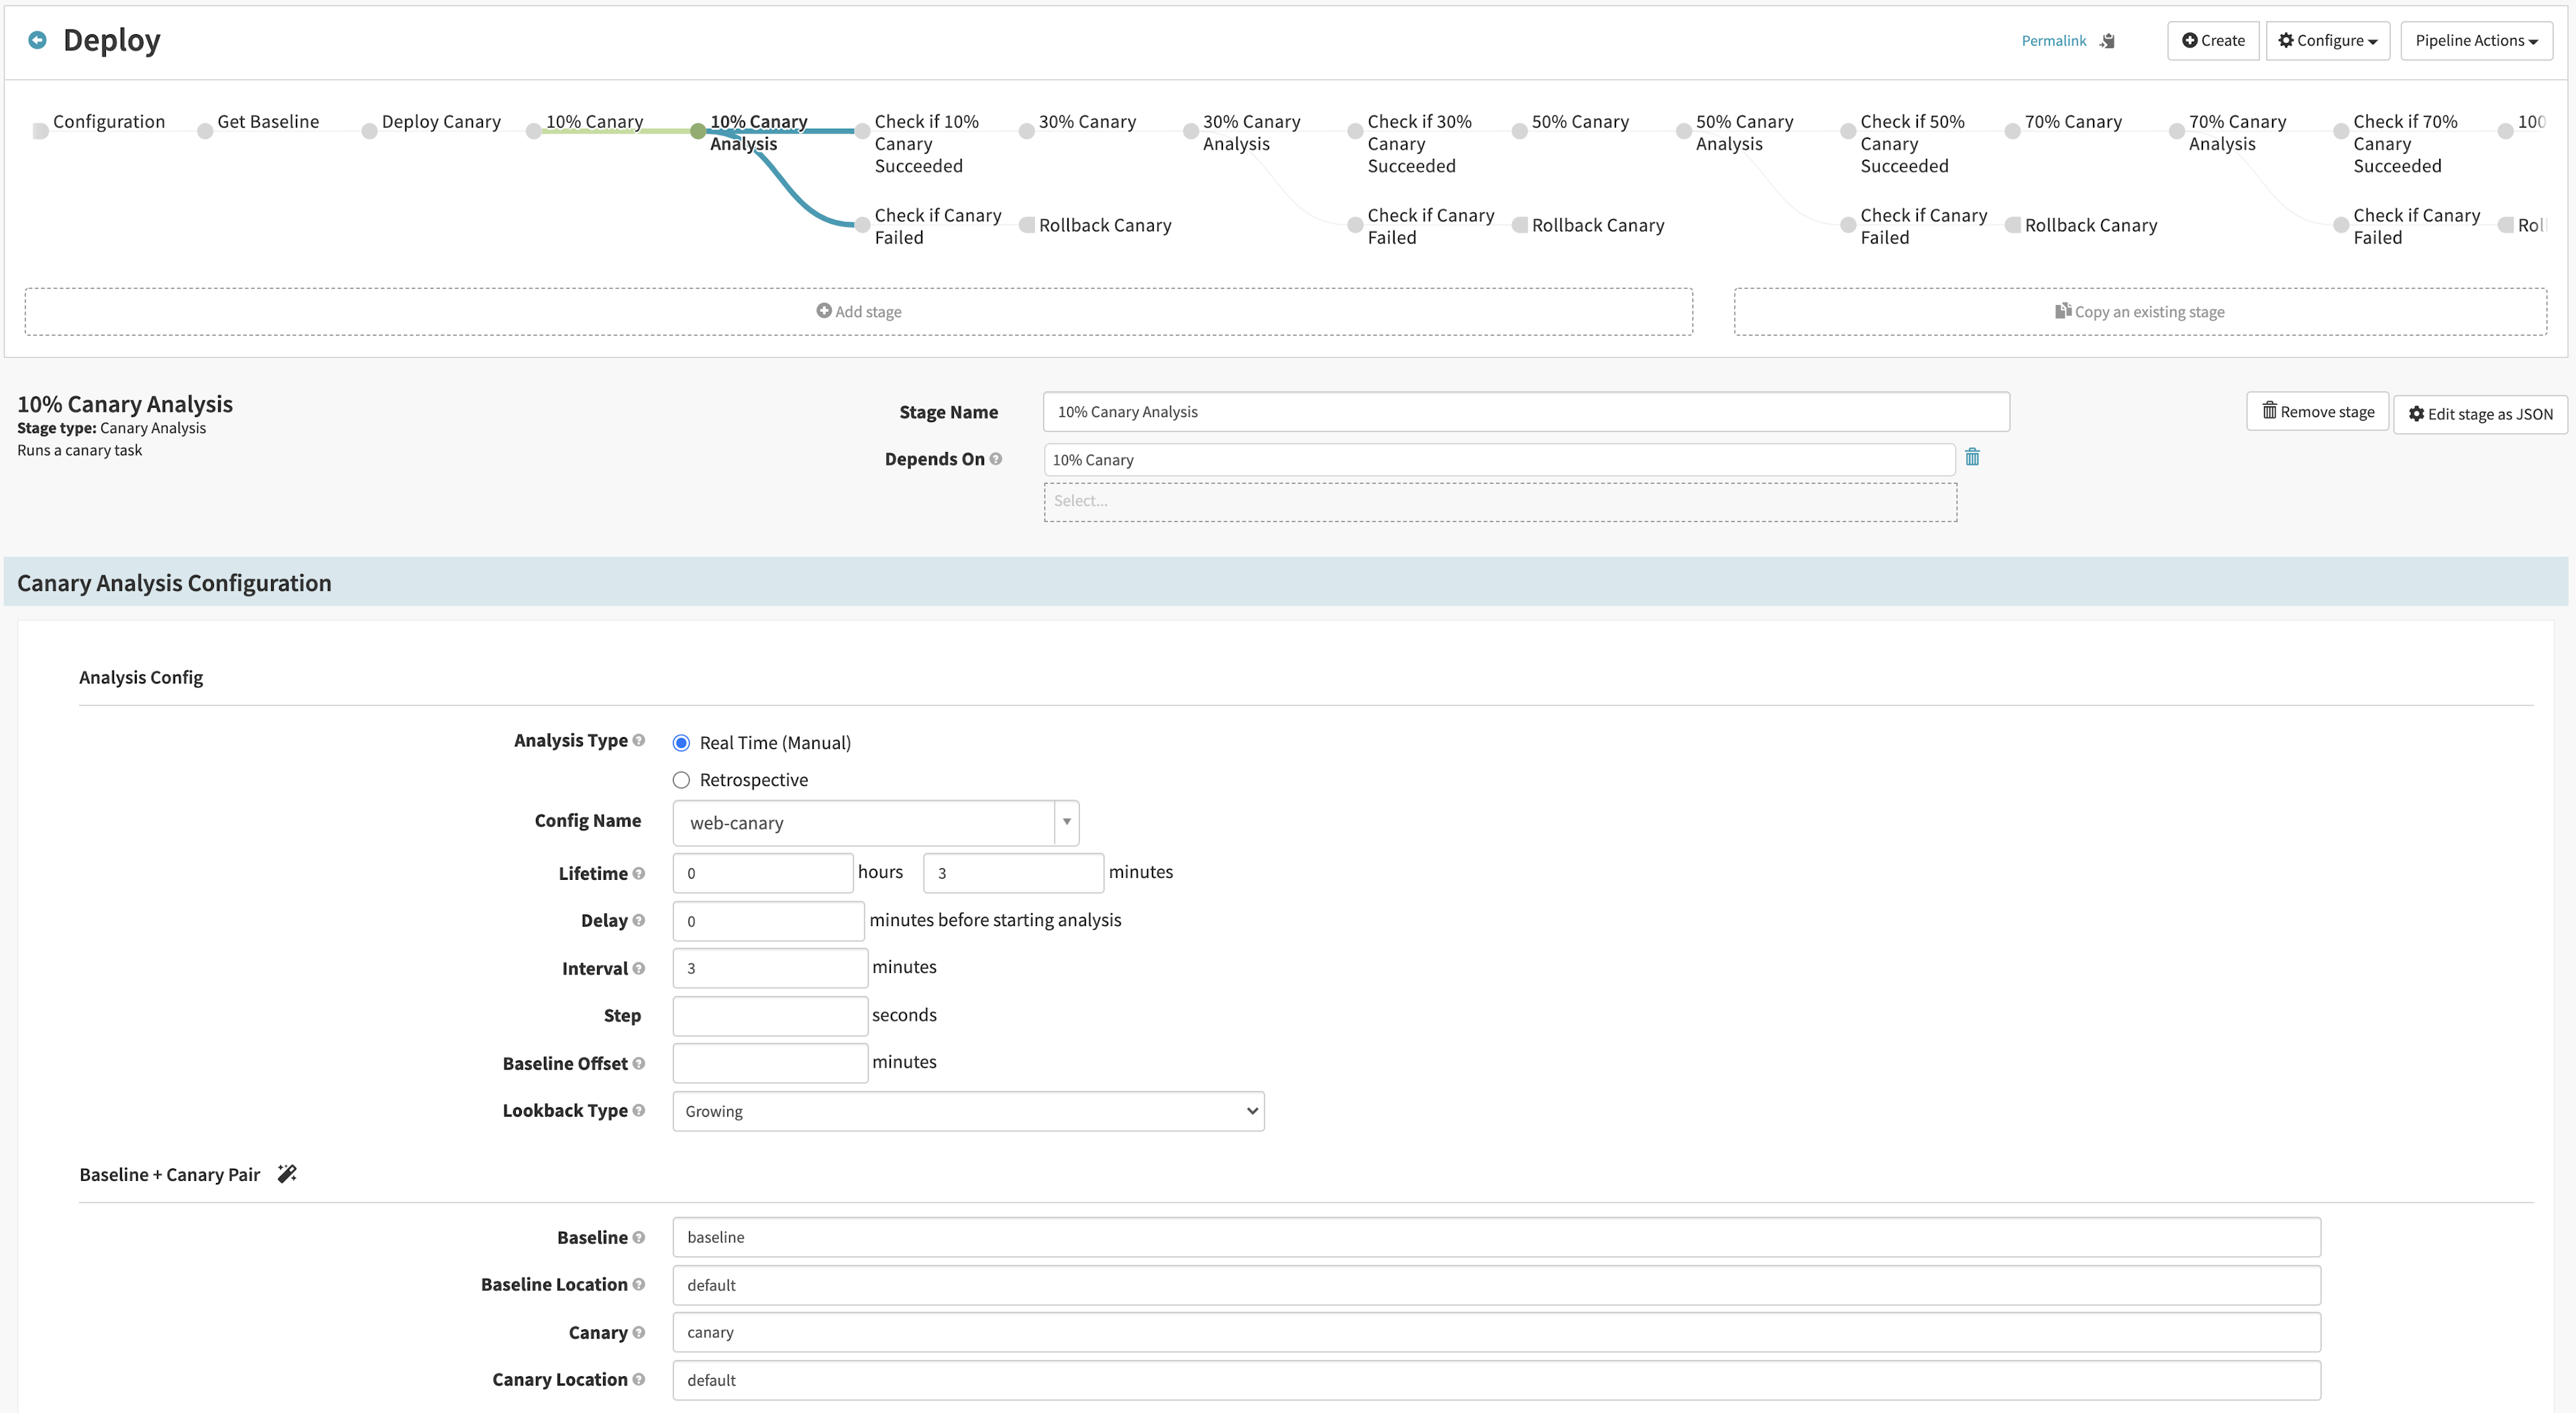
You can configure Spinnaker canary analysis with a variety of parameters. “Lifetime” determines how long the stage will run, “Delay” sets aside time for the requests to warm up, and “Interval” provides a time window for Kayenta to run statistical analysis. In this demonstration example, the canary analysis runs once for three minutes. In your environment, choose the “Lifetime” based on your canary metrics, time for evaluation, and volume of requests.
»Automated Canary Deployment
You can now start a canary deployment for version 2 of “web”. For this example, use the load testing tool k6 to generate some user requests to the “ui” service. Run the script located in the example repository. User requests will generate the data points for Spinnaker’s automated canary analysis:
$ k6 run -e UI_ENDPOINT= k6/script.js --duration 60m
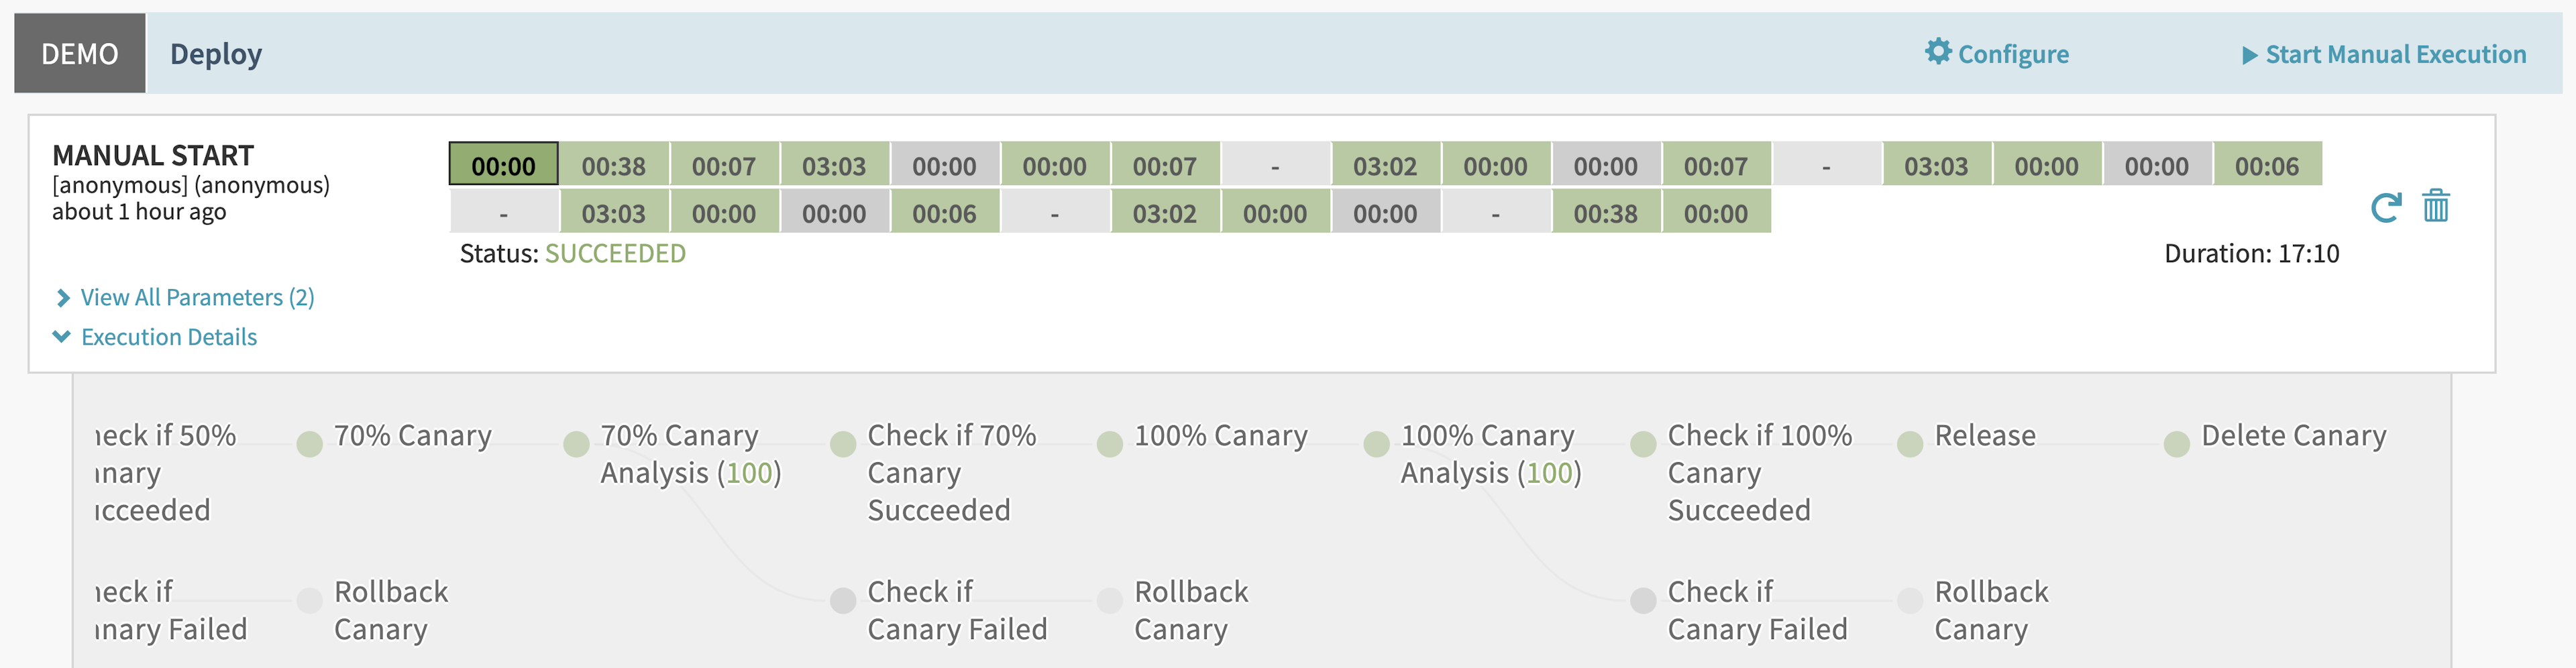
As the pipeline runs, the “web” service continues to respond to user requests. Each request generates data in Prometheus. As the pipeline progresses, it continuously analyzes the user traffic in Prometheus:
After the pipeline passes the 100% canary analysis stage, Spinnaker replaces the baseline release with the canary version. The “Release” stage applies a copy of the canary Kubernetes manifest but includes a tag for “baseline” release. The stage also resets Consul’s ServiceSplitter to default 100% of traffic to the baseline version:
apiVersion: consul.hashicorp.com/v1alpha1
kind: ServiceSplitter
metadata:
  name: web
spec:
  splits:
    - serviceSubset: baseline
      weight: 100
    - serviceSubset: canary
      weight: 0
Finally, the pipeline deletes the canary version of the “web” service:
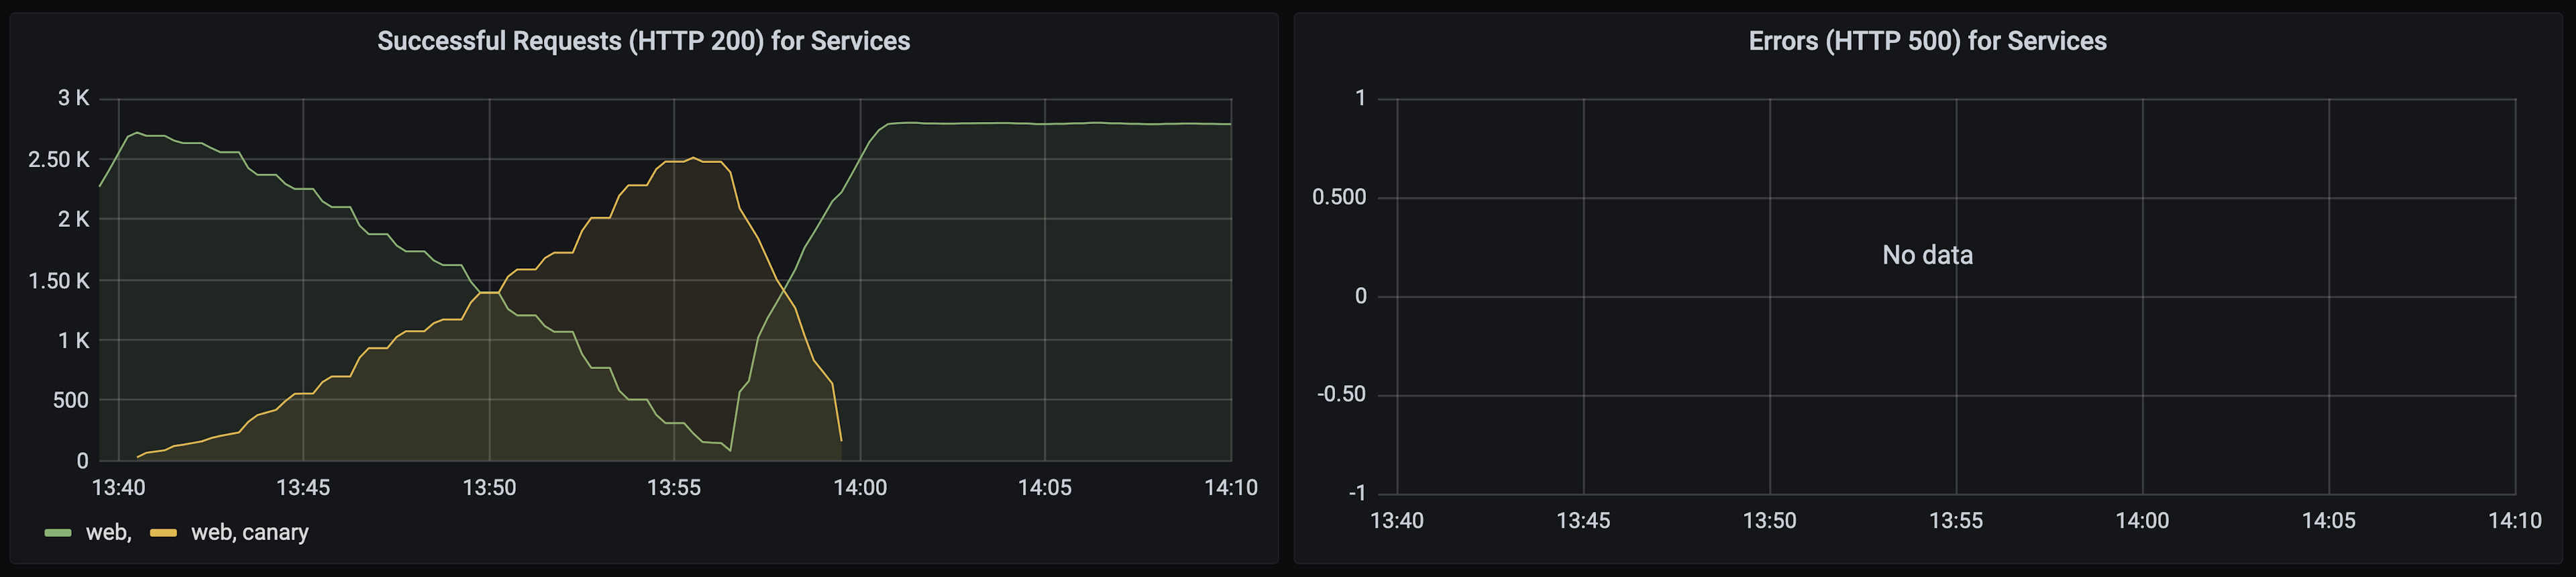
You can examine the effect of the pipeline on the “web” service. The Grafana dashboard shows zero errors in the canary version while running the pipeline. Traffic to the canary increases as the pipeline progresses and canary analyses pass. When the pipeline completes, the new baseline version serves all user requests:
However, what happens when the canary version has a bug? The bug causes no errors at 10% canary traffic. As the pipeline increases the traffic split in Consul to 30% and more users access the service, the bug appears to cause some user errors:
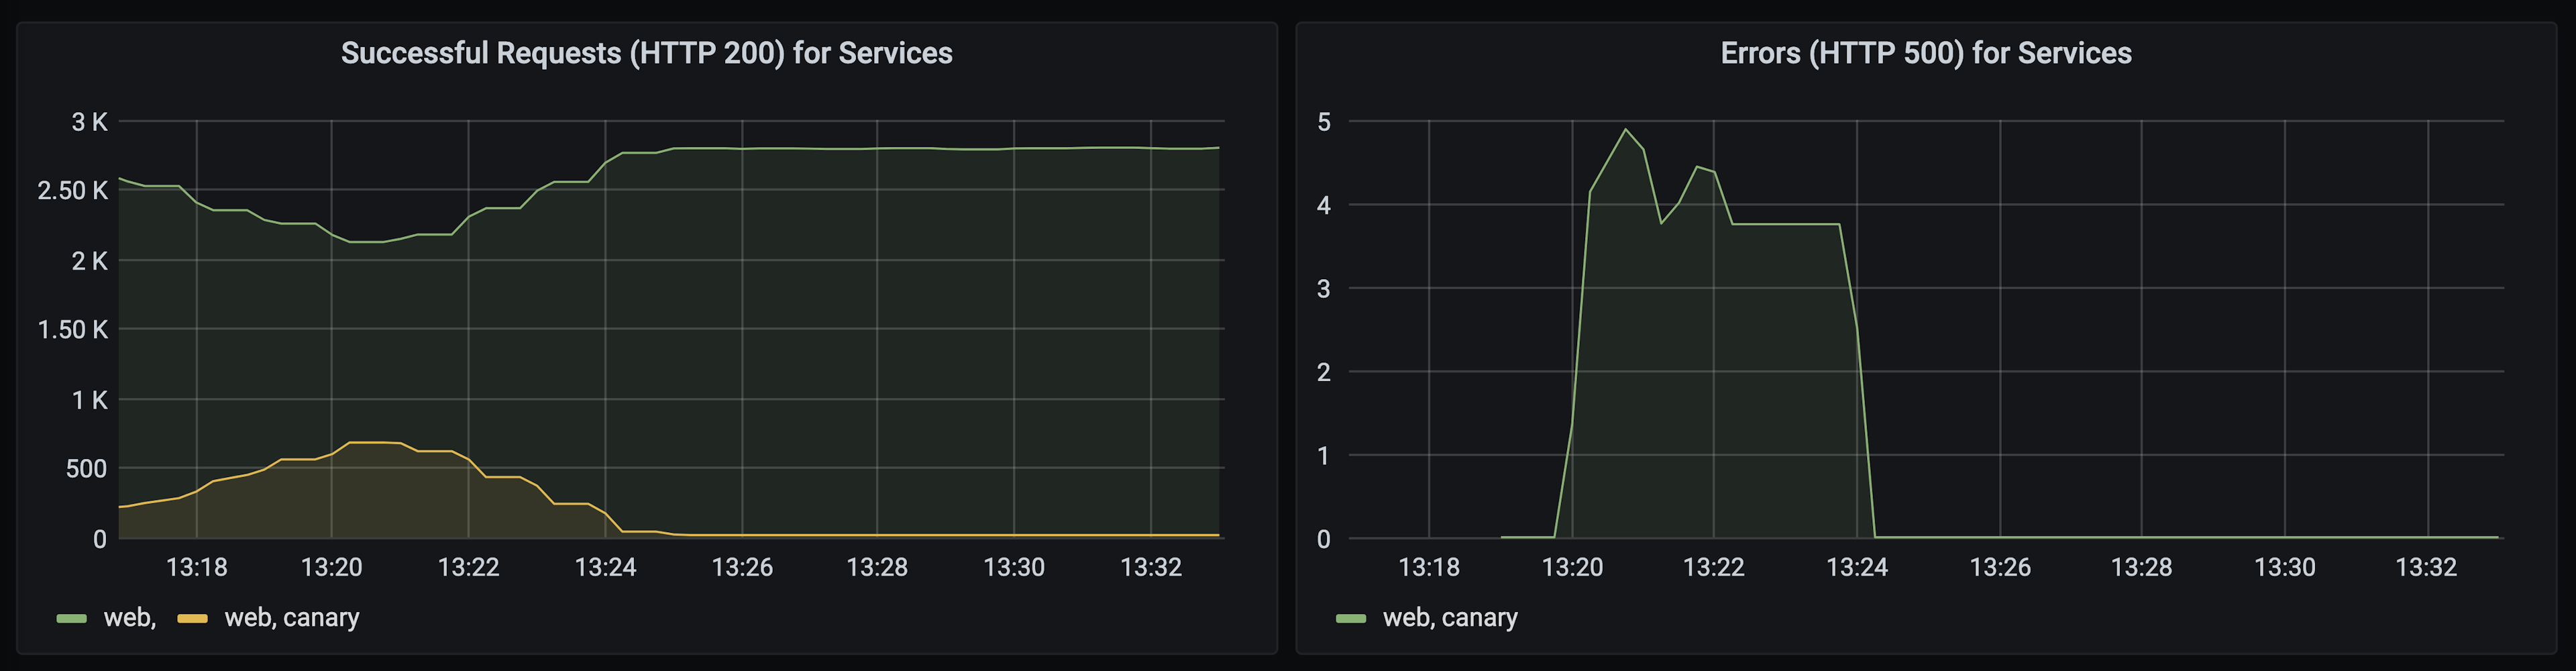
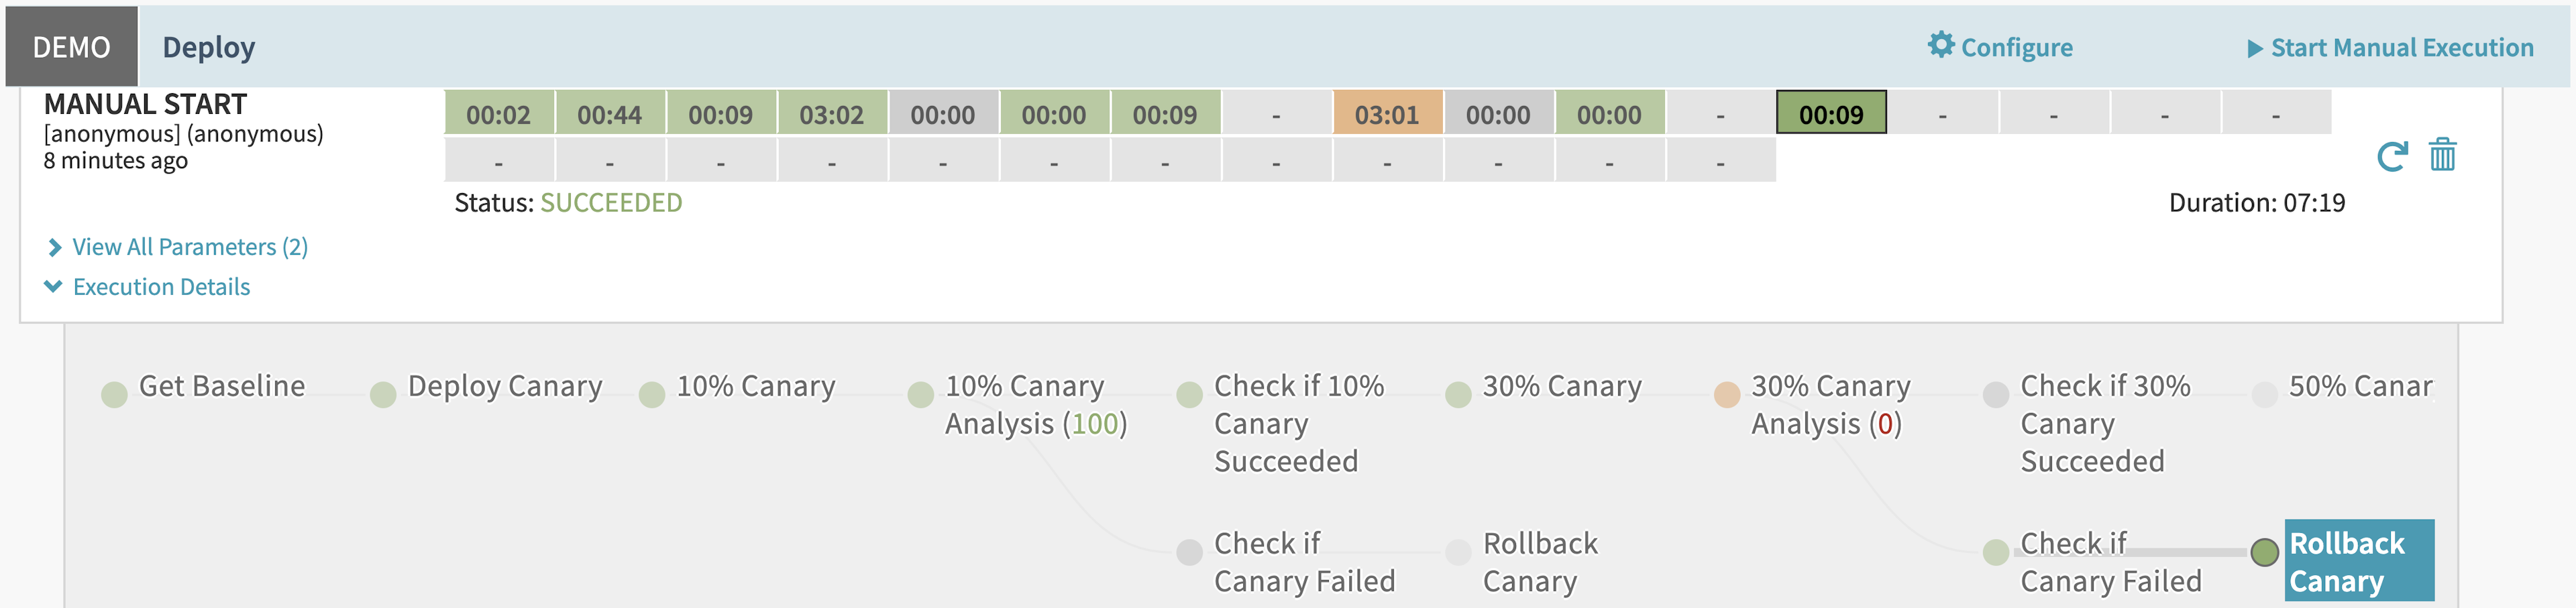
When the pipeline analyzes the canary at 30%, it recognizes the increased error rate. It rolls back the canary by resetting 100% of traffic to the baseline version. You can still use the canary version of the application to debug the error in isolation since it does not receive traffic:
»Conclusion
By adding Consul service mesh’s observability and traffic management to your continuous delivery pipelines, you can implement a side-by-side canary deployment. To further automate the process, you can use Spinnaker’s automated canary analysis to determine when to increase traffic to the new version of your application or system. Automated canary deployment reduces the manual evaluation of metrics and ensures your application’s availability with automated rollback. With the ability to configure Consul outside Kubernetes, you can apply this pattern to any service on any platform, as long as you’ve registered the canary application with the service mesh.
For additional information on configuring Consul for observability, review our tutorial on Learn. Spinnaker can also use metrics collected from other systems, such as Datadog. Check out our blog post on how to use Consul with other metrics systems. To implement automated canary analysis with native Kubernetes tooling, review this example of automated canary deployment using Flagger.
Questions about this post? Add them to the community forum!